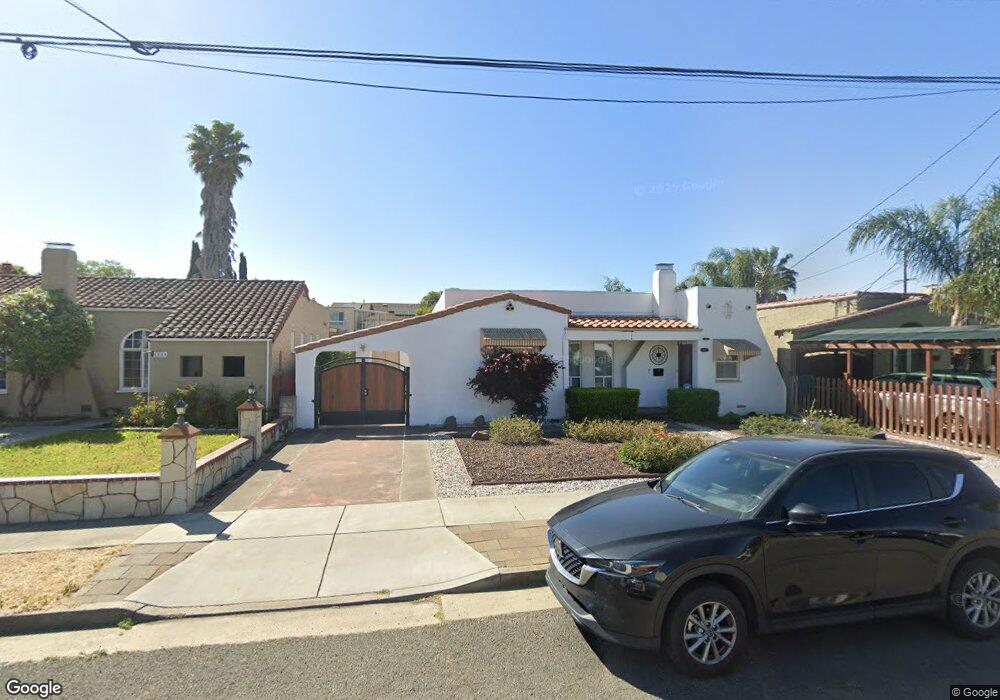
1517 Rice St Vallejo, CA 94590
West Vallejo NeighborhoodEstimated Value: $414,708 - $444,000
2
Beds
1
Bath
1,328
Sq Ft
$323/Sq Ft
Est. Value
About This Home
This home is located at 1517 Rice St, Vallejo, CA 94590 and is currently estimated at $429,427, approximately $323 per square foot. 1517 Rice St is a home located in Solano County with nearby schools including Steffan Manor Elementary, Vallejo High School, and Vallejo Charter School.
Ownership History
Date
Name
Owned For
Owner Type
Purchase Details
Closed on
Feb 23, 2001
Sold by
Mclemore Phillips Annette and Mclemore Annette
Bought by
Mclemore Annette
Current Estimated Value
Home Financials for this Owner
Home Financials are based on the most recent Mortgage that was taken out on this home.
Original Mortgage
$134,400
Outstanding Balance
$48,792
Interest Rate
6.98%
Estimated Equity
$380,635
Purchase Details
Closed on
Jun 28, 1994
Sold by
Davis Richard Bruce and Davis Carla L
Bought by
Phillips Annette Mclemore
Home Financials for this Owner
Home Financials are based on the most recent Mortgage that was taken out on this home.
Original Mortgage
$109,250
Interest Rate
8.6%
Create a Home Valuation Report for This Property
The Home Valuation Report is an in-depth analysis detailing your home's value as well as a comparison with similar homes in the area
Home Values in the Area
Average Home Value in this Area
Purchase History
| Date | Buyer | Sale Price | Title Company |
|---|---|---|---|
| Mclemore Annette | -- | Commonwealth Land Title Co | |
| Phillips Annette Mclemore | $345,000 | First American Title Guarant |
Source: Public Records
Mortgage History
| Date | Status | Borrower | Loan Amount |
|---|---|---|---|
| Open | Mclemore Annette | $134,400 | |
| Closed | Phillips Annette Mclemore | $109,250 |
Source: Public Records
Tax History
| Year | Tax Paid | Tax Assessment Tax Assessment Total Assessment is a certain percentage of the fair market value that is determined by local assessors to be the total taxable value of land and additions on the property. | Land | Improvement |
|---|---|---|---|---|
| 2025 | $3,218 | $195,461 | $59,487 | $135,974 |
| 2024 | $3,218 | $191,629 | $58,321 | $133,308 |
| 2023 | $3,003 | $187,873 | $57,178 | $130,695 |
| 2022 | $2,899 | $184,190 | $56,057 | $128,133 |
| 2021 | $2,832 | $180,579 | $54,958 | $125,621 |
| 2020 | $2,830 | $178,728 | $54,395 | $124,333 |
| 2019 | $2,730 | $175,225 | $53,329 | $121,896 |
| 2018 | $2,545 | $171,790 | $52,284 | $119,506 |
| 2017 | $2,418 | $168,422 | $51,259 | $117,163 |
| 2016 | $1,846 | $165,120 | $50,254 | $114,866 |
| 2015 | $1,821 | $162,641 | $49,500 | $113,141 |
| 2014 | $1,794 | $159,456 | $48,531 | $110,925 |
Source: Public Records
Map
Nearby Homes
Your Personal Tour Guide
Ask me questions while you tour the home.