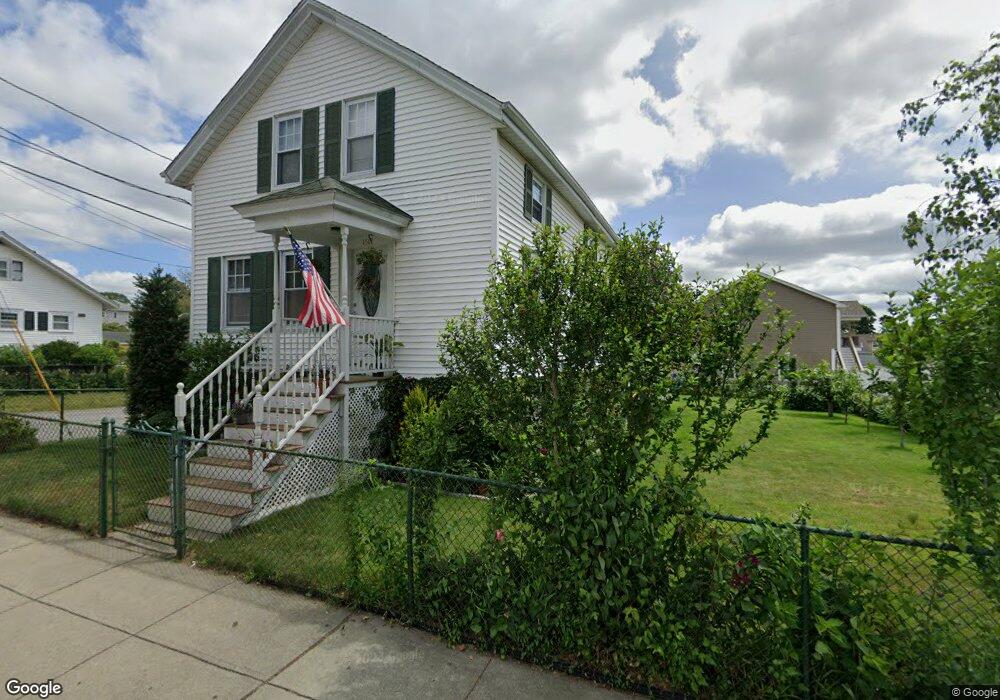
1517 Slade St Fall River, MA 02721
Maplewood NeighborhoodEstimated Value: $319,000 - $430,000
3
Beds
2
Baths
1,023
Sq Ft
$359/Sq Ft
Est. Value
About This Home
This home is located at 1517 Slade St, Fall River, MA 02721 and is currently estimated at $367,065, approximately $358 per square foot. 1517 Slade St is a home located in Bristol County with nearby schools including Letourneau Elementary School, Matthew J. Kuss Middle School, and B M C Durfee High School.
Ownership History
Date
Name
Owned For
Owner Type
Purchase Details
Closed on
Jul 23, 1999
Sold by
Diskin William and Diskin Adele
Bought by
Cabral Mario J and Cabral Rose Marie
Current Estimated Value
Home Financials for this Owner
Home Financials are based on the most recent Mortgage that was taken out on this home.
Original Mortgage
$104,250
Interest Rate
7.49%
Mortgage Type
Purchase Money Mortgage
Create a Home Valuation Report for This Property
The Home Valuation Report is an in-depth analysis detailing your home's value as well as a comparison with similar homes in the area
Home Values in the Area
Average Home Value in this Area
Purchase History
| Date | Buyer | Sale Price | Title Company |
|---|---|---|---|
| Cabral Mario J | $107,500 | -- |
Source: Public Records
Mortgage History
| Date | Status | Borrower | Loan Amount |
|---|---|---|---|
| Open | Cabral Mario J | $95,000 | |
| Closed | Cabral Mario J | $104,250 |
Source: Public Records
Tax History
| Year | Tax Paid | Tax Assessment Tax Assessment Total Assessment is a certain percentage of the fair market value that is determined by local assessors to be the total taxable value of land and additions on the property. | Land | Improvement |
|---|---|---|---|---|
| 2025 | $3,211 | $280,400 | $108,300 | $172,100 |
| 2024 | $3,025 | $263,300 | $104,300 | $159,000 |
| 2023 | $2,730 | $222,500 | $86,200 | $136,300 |
| 2022 | $2,558 | $202,700 | $82,100 | $120,600 |
| 2021 | $2,404 | $173,800 | $78,100 | $95,700 |
| 2020 | $2,436 | $168,600 | $77,000 | $91,600 |
| 2019 | $2,334 | $160,100 | $74,100 | $86,000 |
| 2018 | $2,254 | $154,200 | $80,300 | $73,900 |
| 2017 | $2,097 | $149,800 | $76,500 | $73,300 |
| 2016 | $2,055 | $150,800 | $81,400 | $69,400 |
| 2015 | $1,972 | $150,800 | $81,400 | $69,400 |
| 2014 | $1,867 | $148,400 | $79,000 | $69,400 |
Source: Public Records
Map
Nearby Homes