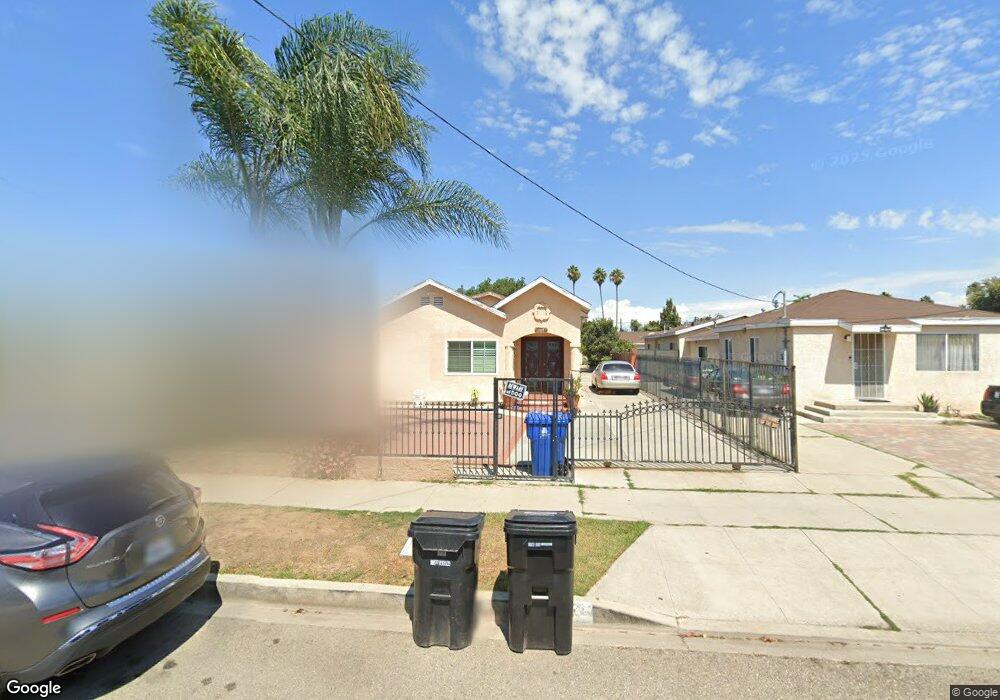
1517 W 222nd St Torrance, CA 90501
Harbor Gateway NeighborhoodEstimated Value: $813,000 - $1,051,000
3
Beds
3
Baths
1,590
Sq Ft
$586/Sq Ft
Est. Value
About This Home
This home is located at 1517 W 222nd St, Torrance, CA 90501 and is currently estimated at $931,976, approximately $586 per square foot. 1517 W 222nd St is a home located in Los Angeles County with nearby schools including Meyler Street Elementary School, Alexander Fleming Middle School, and Nathaniel Narbonne Senior High School.
Ownership History
Date
Name
Owned For
Owner Type
Purchase Details
Closed on
Feb 25, 2005
Sold by
Serrano Rafael L and Deserrano Rosa M Ortiz
Bought by
Serrano Rafael L
Current Estimated Value
Home Financials for this Owner
Home Financials are based on the most recent Mortgage that was taken out on this home.
Original Mortgage
$227,500
Outstanding Balance
$114,495
Interest Rate
5.5%
Mortgage Type
Purchase Money Mortgage
Estimated Equity
$817,481
Purchase Details
Closed on
Feb 13, 1996
Sold by
Nunez Rafael
Bought by
Serrano Rafael L and Ortiz Rosa Maria Serrano
Home Financials for this Owner
Home Financials are based on the most recent Mortgage that was taken out on this home.
Original Mortgage
$117,325
Interest Rate
7%
Purchase Details
Closed on
Sep 27, 1995
Sold by
Emc Mtg Corp
Bought by
Nunez Rafael and Nunez Maria J
Purchase Details
Closed on
Jan 5, 1995
Sold by
Oldenburg Horst and Catchings Valerie
Bought by
Emc Mtg Corp
Create a Home Valuation Report for This Property
The Home Valuation Report is an in-depth analysis detailing your home's value as well as a comparison with similar homes in the area
Home Values in the Area
Average Home Value in this Area
Purchase History
| Date | Buyer | Sale Price | Title Company |
|---|---|---|---|
| Serrano Rafael L | -- | United Independent Title Co | |
| Serrano Rafael L | $505,227 | Fidelity Title | |
| Nunez Rafael | $70,000 | Continental Lawyers Title Co | |
| Emc Mtg Corp | $5,000 | Investors Title |
Source: Public Records
Mortgage History
| Date | Status | Borrower | Loan Amount |
|---|---|---|---|
| Open | Serrano Rafael L | $227,500 | |
| Closed | Serrano Rafael L | $117,325 |
Source: Public Records
Tax History Compared to Growth
Tax History
| Year | Tax Paid | Tax Assessment Tax Assessment Total Assessment is a certain percentage of the fair market value that is determined by local assessors to be the total taxable value of land and additions on the property. | Land | Improvement |
|---|---|---|---|---|
| 2025 | $4,425 | $330,734 | $164,119 | $166,615 |
| 2024 | $4,425 | $324,250 | $160,901 | $163,349 |
| 2023 | $4,344 | $317,894 | $157,747 | $160,147 |
| 2022 | $4,153 | $311,661 | $154,654 | $157,007 |
| 2021 | $4,096 | $305,551 | $151,622 | $153,929 |
| 2019 | $3,979 | $296,490 | $147,126 | $149,364 |
| 2018 | $3,864 | $290,678 | $144,242 | $146,436 |
| 2016 | $3,681 | $279,392 | $138,642 | $140,750 |
| 2015 | $3,627 | $275,196 | $136,560 | $138,636 |
| 2014 | $3,641 | $269,806 | $133,885 | $135,921 |
Source: Public Records
Map
Nearby Homes
- 1524 W 222nd St
- 1542 W 223rd St
- 1546 W 223rd St
- 1503 W 224th St
- 1414 W 224th St
- 1617 W 224th St
- 1636 W 219th St
- 1544 Plaza Del Amo
- 1547 W 226th St
- 1654 Plaza Del Amo
- 1569 W 218th St
- 1229 W 223rd St Unit 113
- 1570 W 226th St
- 1612 W 226th St
- 21726 Halldale Ave
- 1510 W 227th St
- 1444 W 227th St Unit 2
- 22720 Harvard Blvd
- 22305 Sage Ct
- The Azura Plan at Sage Walk
- 1521 W 222nd St
- 1513 W 222nd St
- 1525 W 222nd St
- 1509 W 222nd St
- 1529 W 222nd St
- 1505 W 222nd St
- 22105 Denker Ave
- 1533 W 222nd St
- 1503 W 222nd St
- 1516 W 221st St
- 1512 W 221st St
- 1520 W 221st St
- 1524 W 221st St
- 1537 W 222nd St
- 1508 W 221st St
- 1528 W 221st St
- 1520 W 222nd St
- 1541 W 222nd St
- 1516 W 222nd St
- 1504 W 222nd St