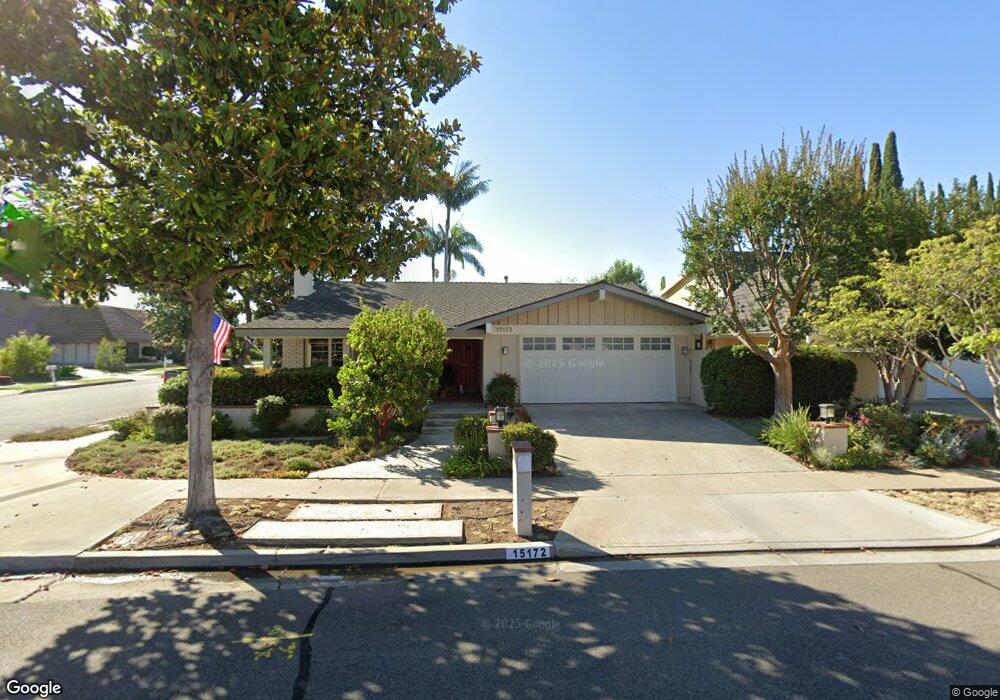
15172 Lille Cir Irvine, CA 92604
Walnut NeighborhoodEstimated Value: $1,464,000 - $1,631,000
4
Beds
2
Baths
1,649
Sq Ft
$931/Sq Ft
Est. Value
About This Home
This home is located at 15172 Lille Cir, Irvine, CA 92604 and is currently estimated at $1,534,786, approximately $930 per square foot. 15172 Lille Cir is a home located in Orange County with nearby schools including Deerfield Elementary School, Venado Middle School, and Irvine High School.
Ownership History
Date
Name
Owned For
Owner Type
Purchase Details
Closed on
Oct 30, 2009
Sold by
Daly John Joseph and Daly Diane Nelson
Bought by
Daly John Joseph and Daly Diane Nelson
Current Estimated Value
Purchase Details
Closed on
Sep 29, 1997
Sold by
Daly John Joseph and Nelson Diane Lee
Bought by
Daly John Joseph and Nelson Diane Lee
Home Financials for this Owner
Home Financials are based on the most recent Mortgage that was taken out on this home.
Original Mortgage
$230,400
Outstanding Balance
$36,984
Interest Rate
7.44%
Estimated Equity
$1,497,802
Purchase Details
Closed on
May 21, 1997
Sold by
John Daly and John Diame L
Bought by
Daly John Joseph and Nelson Diane Lee
Purchase Details
Closed on
Feb 1, 1994
Sold by
Paul Charles B and Paul Janice Lynn
Bought by
Daly John J and Nelson Diane L
Home Financials for this Owner
Home Financials are based on the most recent Mortgage that was taken out on this home.
Original Mortgage
$224,000
Interest Rate
4.25%
Create a Home Valuation Report for This Property
The Home Valuation Report is an in-depth analysis detailing your home's value as well as a comparison with similar homes in the area
Home Values in the Area
Average Home Value in this Area
Purchase History
| Date | Buyer | Sale Price | Title Company |
|---|---|---|---|
| Daly John Joseph | -- | None Available | |
| Daly John Joseph | -- | Lawyers Title Co | |
| Daly John Joseph | -- | -- | |
| Daly John J | $286,000 | Commonwealth Land Title |
Source: Public Records
Mortgage History
| Date | Status | Borrower | Loan Amount |
|---|---|---|---|
| Open | Daly John Joseph | $230,400 | |
| Closed | Daly John J | $224,000 |
Source: Public Records
Tax History
| Year | Tax Paid | Tax Assessment Tax Assessment Total Assessment is a certain percentage of the fair market value that is determined by local assessors to be the total taxable value of land and additions on the property. | Land | Improvement |
|---|---|---|---|---|
| 2025 | $5,153 | $486,103 | $335,118 | $150,985 |
| 2024 | $5,153 | $476,572 | $328,547 | $148,025 |
| 2023 | $5,020 | $467,228 | $322,105 | $145,123 |
| 2022 | $4,922 | $458,067 | $315,789 | $142,278 |
| 2021 | $4,808 | $449,086 | $309,597 | $139,489 |
| 2020 | $4,781 | $444,482 | $306,423 | $138,059 |
| 2019 | $4,675 | $435,767 | $300,415 | $135,352 |
| 2018 | $4,592 | $427,223 | $294,524 | $132,699 |
| 2017 | $4,497 | $418,847 | $288,749 | $130,098 |
| 2016 | $4,301 | $410,635 | $283,087 | $127,548 |
| 2015 | $4,237 | $404,467 | $278,834 | $125,633 |
| 2014 | $4,156 | $396,545 | $273,372 | $123,173 |
Source: Public Records
Map
Nearby Homes
- 15231 Touraine Way
- 5101 Chateau Cir
- 15335 Seine Cir
- 15441 Alsace Cir
- 14851 Jeffrey Rd Unit 69
- 14851 Jeffrey Rd Unit 61
- 14851 Jeffrey Rd Unit 192
- 14851 Jeffrey Rd Unit 241
- 14851 Jeffrey Rd Unit 145
- 14851 Jeffrey Rd Unit 246
- 14851 Jeffrey Rd Unit 7
- 14851 Jeffrey Rd Unit 326
- 14851 Jeffrey Rd Unit 117
- 14851 Jeffrey Rd Unit 248
- 14851 Jeffrey Rd Unit 199
- 13 Shooting Star
- 95 Wildwood Unit 40
- 14921 Pinehaven Rd
- 18 Brookdale
- 3 Sunset River
- 15182 Lille Cir
- 15171 Chalon Cir
- 15181 Chalon Cir
- 15192 Lille Cir
- 5201 Bordeaux Ave
- 5191 Bordeaux Ave
- 15171 Lille Cir
- 5211 Bordeaux Ave
- 15191 Chalon Cir
- 15181 Lille Cir
- 5181 Bordeaux Ave
- 15202 Lille Cir
- 5221 Bordeaux Ave
- 15191 Lille Cir
- 15201 Chalon Cir
- 5171 Bordeaux Ave
- 5231 Bordeaux Ave
- 15201 Lille Cir
- 15172 Vichy Cir
- 15172 Chalon Cir
Your Personal Tour Guide
Ask me questions while you tour the home.