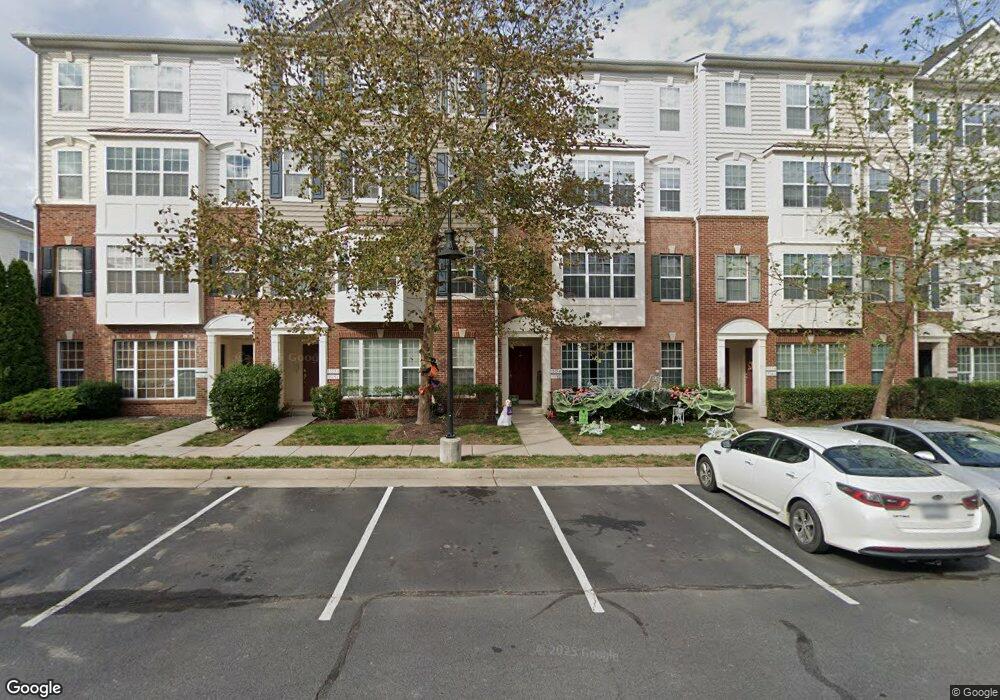
15179 Sage Run Rd Unit 83 Haymarket, VA 20169
Silver Lake NeighborhoodEstimated Value: $429,000 - $435,000
2
Beds
3
Baths
1,547
Sq Ft
$280/Sq Ft
Est. Value
About This Home
This home is located at 15179 Sage Run Rd Unit 83, Haymarket, VA 20169 and is currently estimated at $433,076, approximately $279 per square foot. 15179 Sage Run Rd Unit 83 is a home located in Prince William County with nearby schools including Haymarket Elementary School, Ronald Wilson Reagan Middle School, and Battlefield High School.
Ownership History
Date
Name
Owned For
Owner Type
Purchase Details
Closed on
Jun 2, 2022
Sold by
Sanchez Guzman Maria M
Bought by
Uffelman Chaney W and Uffelman Dana L
Current Estimated Value
Home Financials for this Owner
Home Financials are based on the most recent Mortgage that was taken out on this home.
Original Mortgage
$340,000
Outstanding Balance
$322,999
Interest Rate
5.09%
Mortgage Type
New Conventional
Estimated Equity
$110,077
Purchase Details
Closed on
Jun 28, 2017
Sold by
Collins Monica
Bought by
Guzman Maria M Sanchez
Home Financials for this Owner
Home Financials are based on the most recent Mortgage that was taken out on this home.
Original Mortgage
$178,500
Interest Rate
4.02%
Mortgage Type
New Conventional
Purchase Details
Closed on
Sep 28, 2010
Sold by
Beazer Homes Corp
Bought by
Collins M
Create a Home Valuation Report for This Property
The Home Valuation Report is an in-depth analysis detailing your home's value as well as a comparison with similar homes in the area
Home Values in the Area
Average Home Value in this Area
Purchase History
| Date | Buyer | Sale Price | Title Company |
|---|---|---|---|
| Uffelman Chaney W | $400,000 | First American Title | |
| Guzman Maria M Sanchez | $258,500 | Stewart Title Guaranty Co | |
| Collins M | $227,990 | Homebuilders Title Services |
Source: Public Records
Mortgage History
| Date | Status | Borrower | Loan Amount |
|---|---|---|---|
| Open | Uffelman Chaney W | $340,000 | |
| Previous Owner | Guzman Maria M Sanchez | $178,500 |
Source: Public Records
Tax History Compared to Growth
Tax History
| Year | Tax Paid | Tax Assessment Tax Assessment Total Assessment is a certain percentage of the fair market value that is determined by local assessors to be the total taxable value of land and additions on the property. | Land | Improvement |
|---|---|---|---|---|
| 2025 | $4,005 | $425,400 | $116,200 | $309,200 |
| 2024 | $4,005 | $402,700 | $111,000 | $291,700 |
| 2023 | $3,716 | $357,100 | $97,900 | $259,200 |
| 2022 | $3,734 | $337,200 | $92,000 | $245,200 |
| 2021 | $3,555 | $290,500 | $75,800 | $214,700 |
| 2020 | $4,185 | $270,000 | $65,000 | $205,000 |
| 2019 | $3,982 | $256,900 | $65,000 | $191,900 |
| 2018 | $2,921 | $241,900 | $65,000 | $176,900 |
| 2017 | $2,760 | $222,400 | $63,900 | $158,500 |
| 2016 | $2,694 | $219,000 | $75,200 | $143,800 |
| 2015 | $2,771 | $225,600 | $75,200 | $150,400 |
| 2014 | $2,771 | $220,700 | $62,600 | $158,100 |
Source: Public Records
Map
Nearby Homes
- 6149 Aster Haven Cir
- 6153 Aster Haven Cir Unit 57
- 15126 Lilywood Ln
- 15269 Avens Creek Dr Unit 79
- 6103 Aster Haven Cir Unit 149
- 6287 Aster Haven Cir Unit 8
- 6066 Aster Haven Cir Unit 131
- 6113 Camerons Ferry Dr
- 15272 Cartersville Ct
- 15288 Westham Ct
- 15303 Linville Creek Dr
- 5800 Moonstone Way Unit 201
- 5800 Moonstone Way Unit 1
- 5840 Moonstone Way Unit 6
- 5800 Moonstone Way Unit 204
- 5800 Moonstone Way Unit 3
- 5800 Moonstone Way Unit 402
- 5800 Moonstone Way Unit 406
- 5800 Moonstone Way Unit 403
- 5840 Moonstone Way Unit 5
- 15179 Sage Run Rd
- 15183 Sage Run Rd Unit 81
- 15185 Sage Run Rd
- 15185 Sage Run Rd Unit 82
- 15173 Sage Run Rd
- 15171 Sage Run Rd
- 15171 Sage Run Rd Unit 87
- 15189 Sage Run Rd
- 15189 Sage Run Rd Unit 80
- 15187 Sage Run Rd Unit 79
- 15187 Sage Run Rd
- 15183 Sage Run Rd Unit 81
- 0 Sage Run Rd Unit 76 1004466280
- 15154 Silica St Unit 96
- 15152 Silica St Unit 95
- 15158 Silica St Unit 98
- 15156 Silica St
- 15156 Silica St Unit 97
- 15148 Silica St
- 15178 Sage Run Rd