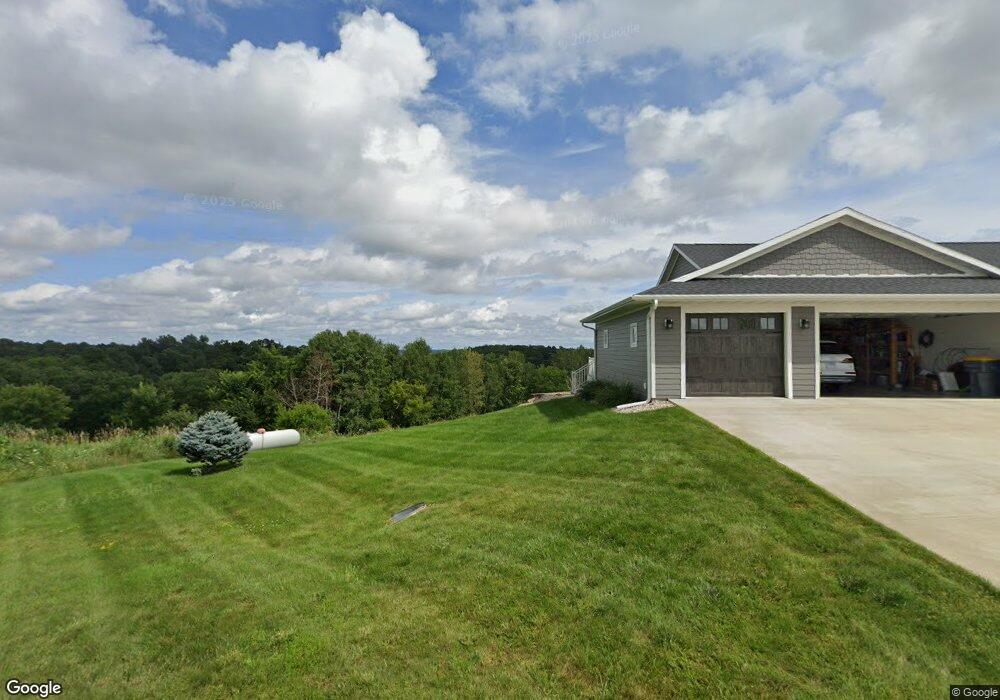
1518 Ambrosia St La Crescent, MN 55947
Estimated Value: $642,000 - $771,000
3
Beds
3
Baths
1,768
Sq Ft
$392/Sq Ft
Est. Value
About This Home
This home is located at 1518 Ambrosia St, La Crescent, MN 55947 and is currently estimated at $692,948, approximately $391 per square foot. 1518 Ambrosia St is a home located in Winona County with nearby schools including La Crescent-Hokah Elementary School, La Crescent-Hokah Middle School, and La Crescent-Hokah High School.
Ownership History
Date
Name
Owned For
Owner Type
Purchase Details
Closed on
Sep 20, 2024
Sold by
Nothaus Briar N and Nothaus Audra G
Bought by
Rudder Nolan and Rudder Emily
Current Estimated Value
Home Financials for this Owner
Home Financials are based on the most recent Mortgage that was taken out on this home.
Original Mortgage
$544,000
Outstanding Balance
$537,885
Interest Rate
6.47%
Mortgage Type
New Conventional
Estimated Equity
$155,063
Purchase Details
Closed on
Jun 23, 2022
Sold by
Trust Agreement Of Bryan And Kristine Ra
Bought by
Nothaus Briar N and Clements Audra G
Home Financials for this Owner
Home Financials are based on the most recent Mortgage that was taken out on this home.
Original Mortgage
$416,000
Interest Rate
5.3%
Mortgage Type
New Conventional
Purchase Details
Closed on
Jul 13, 2018
Sold by
Hemker Nancy A
Bought by
Rademacher Bryan S and Rademacher Kristine M
Create a Home Valuation Report for This Property
The Home Valuation Report is an in-depth analysis detailing your home's value as well as a comparison with similar homes in the area
Home Values in the Area
Average Home Value in this Area
Purchase History
| Date | Buyer | Sale Price | Title Company |
|---|---|---|---|
| Rudder Nolan | $680,000 | None Listed On Document | |
| Nothaus Briar N | $520,000 | Prinsen Brandon J | |
| Rademacher Bryan S | $45,000 | None Available |
Source: Public Records
Mortgage History
| Date | Status | Borrower | Loan Amount |
|---|---|---|---|
| Open | Rudder Nolan | $544,000 | |
| Previous Owner | Nothaus Briar N | $416,000 |
Source: Public Records
Tax History Compared to Growth
Tax History
| Year | Tax Paid | Tax Assessment Tax Assessment Total Assessment is a certain percentage of the fair market value that is determined by local assessors to be the total taxable value of land and additions on the property. | Land | Improvement |
|---|---|---|---|---|
| 2025 | $7,462 | $559,500 | $89,000 | $470,500 |
| 2024 | $7,462 | $537,000 | $89,000 | $448,000 |
| 2023 | $6,742 | $520,800 | $89,000 | $431,800 |
| 2022 | $6,908 | $494,200 | $84,000 | $410,200 |
| 2021 | $6,560 | $432,900 | $73,000 | $359,900 |
| 2020 | $634 | $58,000 | $58,000 | $0 |
| 2019 | $1,052 | $58,000 | $58,000 | $0 |
| 2018 | $1,066 | $58,000 | $58,000 | $0 |
| 2017 | $986 | $0 | $0 | $0 |
| 2016 | $992 | $0 | $0 | $0 |
| 2015 | $992 | $0 | $0 | $0 |
| 2014 | $1,138 | $0 | $0 | $0 |
Source: Public Records
Map
Nearby Homes
- 225 Red Apple Dr
- 0 Crescent Hills Dr
- 726 N 4th St
- Lot 7 & 8 Crescent Hills Dr
- 0 Hill St N
- 512 N Hill St
- 32979 County Road 1
- 540 Jonathan Ln
- 106 Fireside Ct
- 813 Stoney Point Rd
- 28 N Walnut St
- 220 S Maple St
- 428 Backstretch Ct
- 604 Hickory Ct
- 0 Hickory Ln
- 0 County Road 6 Unit 1941351
- 906 Redwood St E
- 32158 County Road 1
- 1626 Lakeshore Dr
- 708 Spillway Dr
- 1518 Ambrosia Ct Ct
- 1518 Ambrosia Ct
- 1514 Ambrosia Ct
- 1514 Ambrosia St
- 1510 Ambrosia Ct Unit 1510
- 1510 Ambrosia St
- 1511 Ambrosia Ct
- 1506 Ambrosia Ct
- 1506 Ct
- 0 County Road 1
- 1515 Ambrosia St
- 1515 Ambrosia Ct
- 1420 Ambrosia St
- 1511 Ambrosia St
- 14xx Ambrosia Ct
- 1416 Ambrosia St
- 1420 Ambrosia Ct
- 1507 Ambrosia Ct
- 1507 Ambrosia St
- 602 Royal Ct