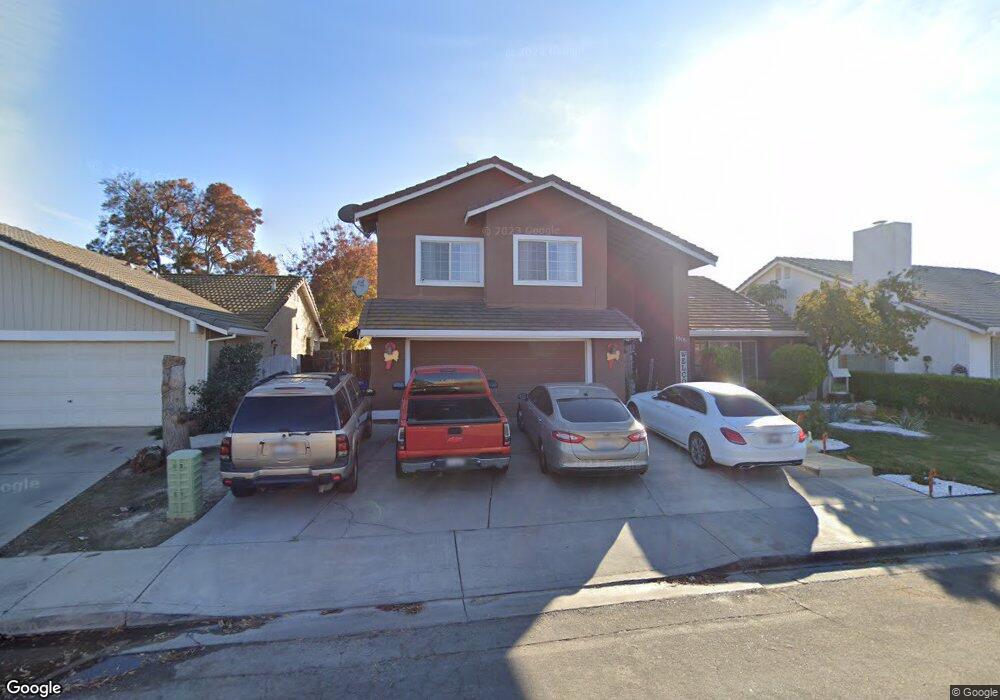
1518 Corgiat Dr Newman, CA 95360
Estimated Value: $457,000 - $467,000
4
Beds
2
Baths
2,130
Sq Ft
$218/Sq Ft
Est. Value
About This Home
This home is located at 1518 Corgiat Dr, Newman, CA 95360 and is currently estimated at $463,648, approximately $217 per square foot. 1518 Corgiat Dr is a home located in Stanislaus County with nearby schools including Orestimba High School.
Ownership History
Date
Name
Owned For
Owner Type
Purchase Details
Closed on
Aug 28, 2009
Sold by
Deutsche Bank National Trust
Bought by
Robles Benjamin and Robles Maria Isabel
Current Estimated Value
Home Financials for this Owner
Home Financials are based on the most recent Mortgage that was taken out on this home.
Original Mortgage
$113,898
Outstanding Balance
$73,768
Interest Rate
5.08%
Mortgage Type
FHA
Estimated Equity
$389,880
Purchase Details
Closed on
Dec 5, 2008
Sold by
Jewell Jeffery and Jewell Tania
Bought by
Deutsche Bank National Trust Company and Morgan Stanley Msac 2007-Nc2
Purchase Details
Closed on
Jun 10, 1998
Sold by
Tooley Jerry L and Tooley Barbara S
Bought by
Jewell Jeffery and Jewell Tania
Home Financials for this Owner
Home Financials are based on the most recent Mortgage that was taken out on this home.
Original Mortgage
$123,420
Interest Rate
6.61%
Mortgage Type
VA
Create a Home Valuation Report for This Property
The Home Valuation Report is an in-depth analysis detailing your home's value as well as a comparison with similar homes in the area
Home Values in the Area
Average Home Value in this Area
Purchase History
| Date | Buyer | Sale Price | Title Company |
|---|---|---|---|
| Robles Benjamin | $116,000 | Lsi Title Agency | |
| Deutsche Bank National Trust Company | $144,500 | Accommodation | |
| Jewell Jeffery | $121,000 | Chicago Title Co |
Source: Public Records
Mortgage History
| Date | Status | Borrower | Loan Amount |
|---|---|---|---|
| Open | Robles Benjamin | $113,898 | |
| Previous Owner | Jewell Jeffery | $123,420 |
Source: Public Records
Tax History
| Year | Tax Paid | Tax Assessment Tax Assessment Total Assessment is a certain percentage of the fair market value that is determined by local assessors to be the total taxable value of land and additions on the property. | Land | Improvement |
|---|---|---|---|---|
| 2025 | $1,925 | $149,718 | $45,171 | $104,547 |
| 2024 | $1,877 | $146,784 | $44,286 | $102,498 |
| 2023 | $1,826 | $143,907 | $43,418 | $100,489 |
| 2022 | $1,793 | $141,086 | $42,567 | $98,519 |
| 2021 | $1,762 | $138,321 | $41,733 | $96,588 |
| 2020 | $1,727 | $136,904 | $41,306 | $95,598 |
| 2019 | $1,732 | $134,221 | $40,497 | $93,724 |
| 2018 | $1,622 | $131,590 | $39,703 | $91,887 |
| 2017 | $1,751 | $129,011 | $38,925 | $90,086 |
| 2016 | $1,561 | $126,482 | $38,162 | $88,320 |
| 2015 | $1,604 | $124,583 | $37,589 | $86,994 |
| 2014 | $1,590 | $122,143 | $36,853 | $85,290 |
Source: Public Records
Map
Nearby Homes
- 1542 Corgiat Dr
- 1938 Taylor Ave
- 1625 Blue Spruce Way
- 1118 Strawbridge Dr
- 619-657 Inyo Ave
- 2239 Mia Dr
- 2245 Mia Dr
- 2251 Mia Dr
- 2291 George Ct
- 2269 Marlene Ct
- 2252 Mia Dr
- 2258 Marlene Ct
- 2287 Marlene Ct
- 2270 Marlene Ct
- 2265 Travis Ct
- 2288 Marlene Ct
- 2283 Travis Ct
- 2260 Travis Ct
- 2289 Travis Ct
- 2266 Travis Ct
- 1524 Corgiat Dr
- 1512 Corgiat Dr
- 1530 Corgiat Dr
- 1519 Sandy Creek Dr
- 1506 Corgiat Dr
- 1525 Sandy Creek Dr
- 1513 Sandy Creek Dr
- 1513 Corgiat Dr
- 1507 Sandy Creek Dr
- 1531 Sandy Creek Dr
- 1536 Corgiat Dr
- 1500 Corgiat Dr
- 2031 T St
- 1501 Sandy Creek Dr
- 1537 Corgiat Ct
- 1537 Sandy Creek Dr
- 2025 T St
- 1519 Corgiat Ct
- 1518 Sandy Creek Dr
- 1479 Sandy Creek Dr
Your Personal Tour Guide
Ask me questions while you tour the home.