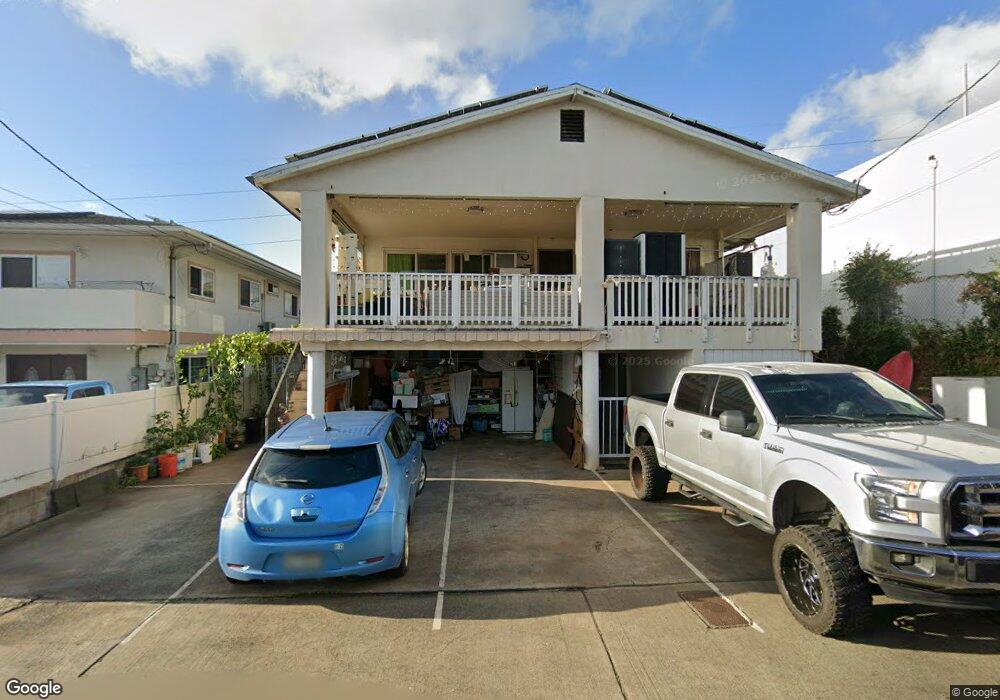
1518 Dement St Honolulu, HI 96819
Kalihi Valley NeighborhoodEstimated Value: $1,054,000 - $1,648,000
10
Beds
6
Baths
1,914
Sq Ft
$711/Sq Ft
Est. Value
About This Home
This home is located at 1518 Dement St, Honolulu, HI 96819 and is currently estimated at $1,359,930, approximately $710 per square foot. 1518 Dement St is a home located in Honolulu County with nearby schools including Kalihi Waena Elementary School, Governor Sanford B Dole Middle School, and Gov. Wallace Rider Farrington High School.
Ownership History
Date
Name
Owned For
Owner Type
Purchase Details
Closed on
Jan 11, 2022
Sold by
Lok Cheong Choi and Zhang Yian
Bought by
Choi Lok Clieong And Yian Fang Zhang Cheong R and Fang Yian
Current Estimated Value
Purchase Details
Closed on
Jun 26, 2007
Sold by
Nenezich Peter Michael and Neilson Nenezich Rosemary
Bought by
Cheong Choi Lok and Cheong Yian Fang Zhang
Home Financials for this Owner
Home Financials are based on the most recent Mortgage that was taken out on this home.
Original Mortgage
$435,000
Interest Rate
6.21%
Mortgage Type
Unknown
Purchase Details
Closed on
Aug 7, 2001
Sold by
Neilson Owen A
Bought by
Nenezich Peter Michael and Neilson Nenezich Rosemary
Create a Home Valuation Report for This Property
The Home Valuation Report is an in-depth analysis detailing your home's value as well as a comparison with similar homes in the area
Home Values in the Area
Average Home Value in this Area
Purchase History
| Date | Buyer | Sale Price | Title Company |
|---|---|---|---|
| Choi Lok Clieong And Yian Fang Zhang Cheong R | -- | None Listed On Document | |
| Choi Lok Clieong And Yian Fang Zhang Cheong R | -- | None Listed On Document | |
| Cheong Choi Lok | $700,000 | Itc | |
| Nenezich Peter Michael | -- | -- | |
| Nenezich Peter Michael | -- | -- |
Source: Public Records
Mortgage History
| Date | Status | Borrower | Loan Amount |
|---|---|---|---|
| Previous Owner | Cheong Choi Lok | $435,000 |
Source: Public Records
Tax History Compared to Growth
Tax History
| Year | Tax Paid | Tax Assessment Tax Assessment Total Assessment is a certain percentage of the fair market value that is determined by local assessors to be the total taxable value of land and additions on the property. | Land | Improvement |
|---|---|---|---|---|
| 2025 | $7,596 | $1,344,900 | $828,000 | $516,900 |
| 2024 | $7,596 | $1,315,400 | $828,000 | $487,400 |
| 2023 | $5,520 | $1,133,300 | $846,400 | $286,900 |
| 2022 | $5,746 | $1,118,700 | $680,800 | $437,900 |
| 2021 | $5,922 | $1,135,400 | $662,400 | $473,000 |
| 2020 | $5,456 | $1,091,000 | $680,800 | $410,200 |
| 2019 | $3,488 | $1,146,400 | $699,200 | $447,200 |
| 2018 | $3,488 | $996,700 | $570,400 | $426,300 |
| 2017 | $3,404 | $972,600 | $533,600 | $439,000 |
| 2016 | $3,293 | $940,800 | $506,000 | $434,800 |
| 2015 | $3,133 | $895,100 | $487,600 | $407,500 |
| 2014 | $2,819 | $850,900 | $423,200 | $427,700 |
Source: Public Records
Map
Nearby Homes
- 1915 Lohilani St Unit B
- 1526 Amelia St
- 1335 Gulick Ave
- 1756-D Gulick Ave
- 1736 Gulick Ave
- 2307 N School St Unit A
- 1260 Richard Ln Unit 406
- 1153 Pinkham St
- 1445 Monte Cooke Place
- 1714 Ema Place
- 1425 Monte Cooke Place
- 2318 Rose St
- 2548 N School St
- 1325 N School St Unit C323
- 1570 Ohu St
- 1313 Ahiahi St
- 1628 Aupuni St
- 2123 Wilson St
- 828 Puuhale Rd Unit III209
- 1709 Perry St
- 1514 Dement St
- 1547 Gulick Ave
- 1510 Dement St
- 1511 Dement St
- 1511 Dement St
- 1533 Gulick Ave
- 1521 Dement St
- 1531 Gulick Ave
- 1932 Ula St
- 1502 Dement St Unit 308B
- 1527 Dement St
- 1525 Gulick Ave
- 1924 Ula St
- 1454 Dement St
- 1521 Gulick Ave
- 1922 Ula St
- 1450 Dement St
- 1607 Gulick Ave
- 1926 N School St
- 1538 Gulick Ave