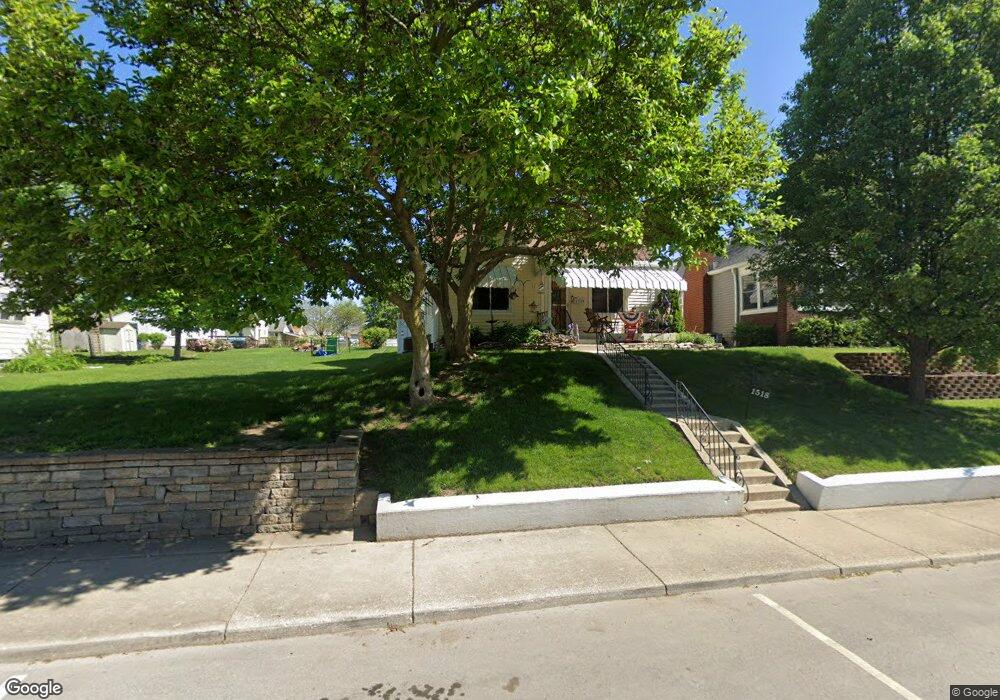
1518 Main St Beech Grove, IN 46107
Estimated Value: $165,000 - $213,518
3
Beds
2
Baths
2,016
Sq Ft
$94/Sq Ft
Est. Value
About This Home
This home is located at 1518 Main St, Beech Grove, IN 46107 and is currently estimated at $189,380, approximately $93 per square foot. 1518 Main St is a home located in Marion County with nearby schools including Hornet Park Elementary School, Central Elementary School, and South Grove Intermediate School.
Ownership History
Date
Name
Owned For
Owner Type
Purchase Details
Closed on
Nov 19, 2015
Sold by
Jones Vanhook Linda M
Bought by
Vanhook Robert L and Vanhook Linda M
Current Estimated Value
Home Financials for this Owner
Home Financials are based on the most recent Mortgage that was taken out on this home.
Original Mortgage
$104,846
Interest Rate
3.5%
Mortgage Type
FHA
Purchase Details
Closed on
Jun 26, 2005
Sold by
Jones Terry L
Bought by
Jones Van Hook Linda M
Create a Home Valuation Report for This Property
The Home Valuation Report is an in-depth analysis detailing your home's value as well as a comparison with similar homes in the area
Home Values in the Area
Average Home Value in this Area
Purchase History
| Date | Buyer | Sale Price | Title Company |
|---|---|---|---|
| Vanhook Robert L | -- | None Available | |
| Jones Van Hook Linda M | -- | None Available |
Source: Public Records
Mortgage History
| Date | Status | Borrower | Loan Amount |
|---|---|---|---|
| Closed | Vanhook Robert L | $104,846 |
Source: Public Records
Tax History Compared to Growth
Tax History
| Year | Tax Paid | Tax Assessment Tax Assessment Total Assessment is a certain percentage of the fair market value that is determined by local assessors to be the total taxable value of land and additions on the property. | Land | Improvement |
|---|---|---|---|---|
| 2024 | $2,273 | $169,800 | $17,100 | $152,700 |
| 2023 | $2,009 | $151,000 | $17,100 | $133,900 |
| 2022 | $1,909 | $139,500 | $17,100 | $122,400 |
| 2021 | $1,536 | $118,200 | $17,100 | $101,100 |
| 2020 | $1,296 | $106,300 | $17,100 | $89,200 |
| 2019 | $1,186 | $101,500 | $14,100 | $87,400 |
| 2018 | $989 | $88,300 | $14,100 | $74,200 |
| 2017 | $989 | $86,800 | $14,100 | $72,700 |
| 2016 | $949 | $84,200 | $14,100 | $70,100 |
| 2014 | $821 | $76,300 | $14,100 | $62,200 |
| 2013 | $729 | $68,000 | $14,100 | $53,900 |
Source: Public Records
Map
Nearby Homes