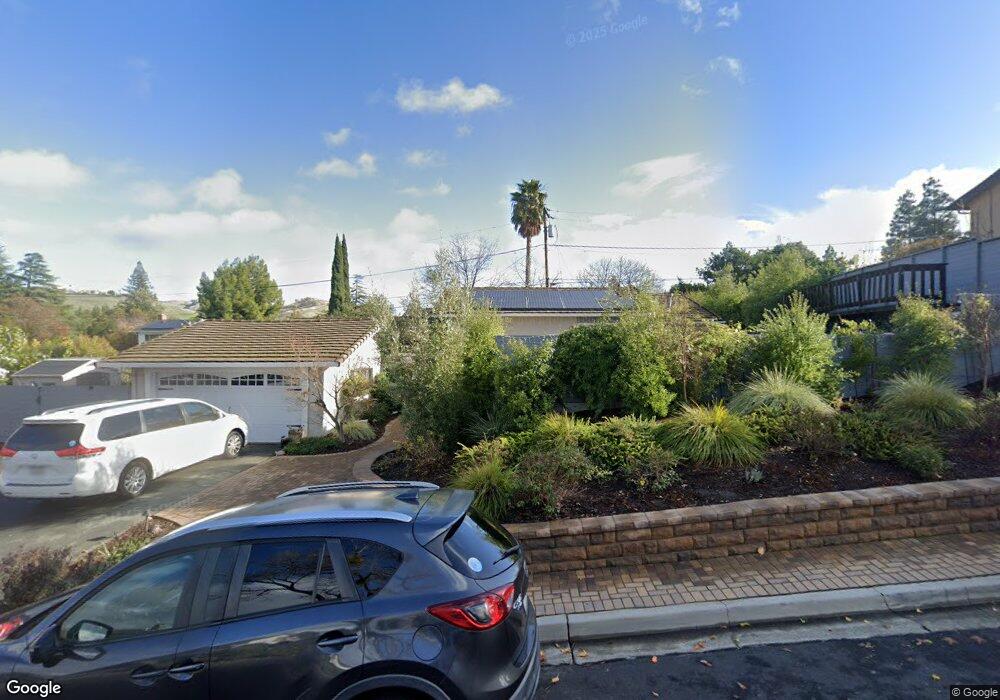
1518 N El Camino Dr Clayton, CA 94517
Estimated Value: $937,799 - $994,000
4
Beds
2
Baths
1,720
Sq Ft
$559/Sq Ft
Est. Value
About This Home
This home is located at 1518 N El Camino Dr, Clayton, CA 94517 and is currently estimated at $961,200, approximately $558 per square foot. 1518 N El Camino Dr is a home located in Contra Costa County with nearby schools including Mt. Diablo Elementary School, Diablo View Middle School, and College Park High School.
Ownership History
Date
Name
Owned For
Owner Type
Purchase Details
Closed on
Sep 19, 2012
Sold by
Haft Julie L and Haft Steven K
Bought by
Keller Marcus and Keller Chrystal
Current Estimated Value
Home Financials for this Owner
Home Financials are based on the most recent Mortgage that was taken out on this home.
Original Mortgage
$375,250
Outstanding Balance
$260,391
Interest Rate
3.63%
Mortgage Type
New Conventional
Estimated Equity
$700,809
Purchase Details
Closed on
Dec 1, 2004
Sold by
Haft Julie L and Haft Steven K
Bought by
Haft Steven K and Haft Julie L
Purchase Details
Closed on
Jul 14, 2004
Sold by
Madison Sharon
Bought by
Haft Steven K and Haft Julie L
Home Financials for this Owner
Home Financials are based on the most recent Mortgage that was taken out on this home.
Original Mortgage
$407,250
Interest Rate
6.27%
Mortgage Type
Stand Alone First
Purchase Details
Closed on
Aug 27, 2001
Sold by
Watt Delmont W and Watt Teresa Kay
Bought by
Watt Delmont William and Watt Teresa Kay
Create a Home Valuation Report for This Property
The Home Valuation Report is an in-depth analysis detailing your home's value as well as a comparison with similar homes in the area
Home Values in the Area
Average Home Value in this Area
Purchase History
| Date | Buyer | Sale Price | Title Company |
|---|---|---|---|
| Keller Marcus | $395,000 | Pacific Coast Title Company | |
| Haft Steven K | $40,500 | -- | |
| Haft Steven K | $707,500 | First American Title | |
| Watt Delmont William | -- | -- |
Source: Public Records
Mortgage History
| Date | Status | Borrower | Loan Amount |
|---|---|---|---|
| Open | Keller Marcus | $375,250 | |
| Previous Owner | Haft Steven K | $407,250 |
Source: Public Records
Tax History Compared to Growth
Tax History
| Year | Tax Paid | Tax Assessment Tax Assessment Total Assessment is a certain percentage of the fair market value that is determined by local assessors to be the total taxable value of land and additions on the property. | Land | Improvement |
|---|---|---|---|---|
| 2025 | $6,506 | $486,400 | $295,535 | $190,865 |
| 2024 | $6,374 | $476,864 | $289,741 | $187,123 |
| 2023 | $6,374 | $467,514 | $284,060 | $183,454 |
| 2022 | $6,277 | $458,348 | $278,491 | $179,857 |
| 2021 | $6,116 | $449,362 | $273,031 | $176,331 |
| 2019 | $5,989 | $436,035 | $264,934 | $171,101 |
| 2018 | $5,761 | $427,487 | $259,740 | $167,747 |
| 2017 | $5,566 | $419,106 | $254,648 | $164,458 |
| 2016 | $5,406 | $410,889 | $249,655 | $161,234 |
| 2015 | $5,334 | $404,718 | $245,905 | $158,813 |
| 2014 | $5,233 | $396,792 | $241,089 | $155,703 |
Source: Public Records
Map
Nearby Homes
- 1498 Delaware Dr
- 5494 Haussner Dr
- 1821 Alicante Ct
- 1835 Camino Estrada
- 5503 Pennsylvania Blvd
- 1829 Yolanda Cir
- 5540 Michigan Blvd
- 5450 Concord Blvd Unit J2
- 1505 Kirker Pass Rd Unit 170
- 1505 Kirker Pass Rd Unit 240
- 1816 Eagle Peak Ave
- 5508 Connecticut Dr
- 5425 Concord Blvd Unit F4
- 415 Chupcan Place Unit 3
- 5555 Alabama Dr
- 1612 Allegro Ave
- 5341 Forte Ln
- 5470 Roundtree Dr Unit F
- 337 Saclan Terrace
- 814 Chert Place
- 1512 N El Camino Dr
- 1524 N El Camino Dr
- 24 Eastbrook Ct
- 30 Eastbrook Ct
- 18 Eastbrook Ct
- 1515 N El Camino Dr
- 36 Eastbrook Ct
- 1523 N El Camino Dr
- 1530 N El Camino Dr
- 1506 N El Camino Dr
- 1509 N El Camino Dr
- 5586 Southbrook Dr
- 5574 Southbrook Dr
- 29 Eastbrook Ct
- 23 Eastbrook Ct
- 42 Eastbrook Ct
- 33 Westbrook Ct
- 25 Westbrook Ct
- 1500 N El Camino Dr
- 35 Eastbrook Ct