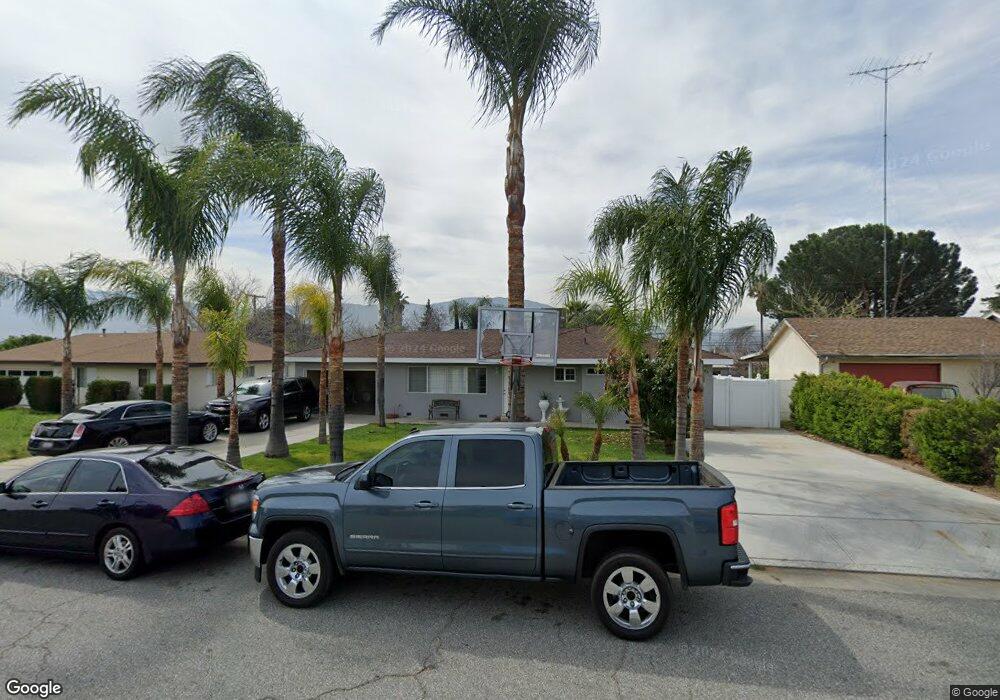
1518 W Jacinto View Rd Banning, CA 92220
Estimated Value: $346,000 - $417,000
3
Beds
1
Bath
1,074
Sq Ft
$360/Sq Ft
Est. Value
About This Home
This home is located at 1518 W Jacinto View Rd, Banning, CA 92220 and is currently estimated at $386,503, approximately $359 per square foot. 1518 W Jacinto View Rd is a home located in Riverside County with nearby schools including Banning High School and Calvary Christian School.
Ownership History
Date
Name
Owned For
Owner Type
Purchase Details
Closed on
May 12, 2016
Sold by
Garcia Cesar Arias
Bought by
Garcia Cesar Arias and Cisneros Villegas Silvia
Current Estimated Value
Home Financials for this Owner
Home Financials are based on the most recent Mortgage that was taken out on this home.
Original Mortgage
$150,200
Outstanding Balance
$66,712
Interest Rate
3.71%
Mortgage Type
New Conventional
Estimated Equity
$319,791
Purchase Details
Closed on
Apr 14, 2004
Sold by
Bogan Dale J and Bogan Susana
Bought by
Garcia Cesar Arias
Home Financials for this Owner
Home Financials are based on the most recent Mortgage that was taken out on this home.
Original Mortgage
$181,000
Interest Rate
5.5%
Mortgage Type
Purchase Money Mortgage
Purchase Details
Closed on
Jan 14, 2004
Sold by
Fernandez Manuel
Bought by
Fernandez Charla
Purchase Details
Closed on
Jan 13, 2004
Sold by
Ross Fred and Fernandez Charla
Bought by
Bogan Dale J and Bogan Susana
Create a Home Valuation Report for This Property
The Home Valuation Report is an in-depth analysis detailing your home's value as well as a comparison with similar homes in the area
Home Values in the Area
Average Home Value in this Area
Purchase History
| Date | Buyer | Sale Price | Title Company |
|---|---|---|---|
| Garcia Cesar Arias | -- | Stewart Title Of Ca Inc | |
| Garcia Cesar Arias | $181,000 | Stewart Title Guaranty | |
| Fernandez Charla | -- | Stewart Title Guaranty | |
| Ross Fred | -- | Stewart Title Guaranty | |
| Bogan Dale J | $95,000 | Stewart Title Guaranty |
Source: Public Records
Mortgage History
| Date | Status | Borrower | Loan Amount |
|---|---|---|---|
| Open | Garcia Cesar Arias | $150,200 | |
| Closed | Garcia Cesar Arias | $181,000 |
Source: Public Records
Tax History Compared to Growth
Tax History
| Year | Tax Paid | Tax Assessment Tax Assessment Total Assessment is a certain percentage of the fair market value that is determined by local assessors to be the total taxable value of land and additions on the property. | Land | Improvement |
|---|---|---|---|---|
| 2025 | $3,526 | $257,316 | $49,748 | $207,568 |
| 2023 | $3,526 | $247,326 | $47,817 | $199,509 |
| 2022 | $3,451 | $242,478 | $46,880 | $195,598 |
| 2021 | $3,385 | $237,724 | $45,961 | $191,763 |
| 2020 | $3,211 | $224,952 | $43,919 | $181,033 |
| 2019 | $3,131 | $218,400 | $42,640 | $175,760 |
| 2018 | $3,052 | $210,000 | $41,000 | $169,000 |
| 2017 | $2,632 | $180,000 | $35,000 | $145,000 |
| 2016 | $2,386 | $168,000 | $32,000 | $136,000 |
| 2015 | $1,776 | $124,000 | $24,000 | $100,000 |
| 2014 | $1,644 | $113,000 | $22,000 | $91,000 |
Source: Public Records
Map
Nearby Homes
- 538 N 14th St
- 1253 Cottonwood Rd
- 1131 W Nicolet St
- 947 W Hays St
- 883 W Nicolet St
- 911 W George St
- 671 N 20th St
- 1574 W Lincoln St
- 779 N 20th St
- 740 Bennett Place
- 688 W Nicolet St
- 676 W Nicolet St
- 2288 W Williams St
- 640 W Nicolet St
- 2200 W Wilson St Unit 125
- 2200 W Wilson St Unit 41
- 2200 W Wilson St Unit 71
- 2200 W Wilson St Unit 123
- 2200 W Wilson St Unit 178
- 2200 W Wilson St Unit 122
- 1538 W Jacinto View Rd
- 1498 W Jacinto View Rd
- 1517 W Williams St
- 1558 W Jacinto View Rd
- 1535 W Williams St
- 1478 W Jacinto View Rd
- 1497 W Williams St
- 1517 W Jacinto View Rd
- 1559 W Williams St
- 1479 W Williams St
- 1497 W Jacinto View Rd
- 1535 W Jacinto View Rd
- 1458 W Jacinto View Rd
- 1576 W Jacinto View Rd
- 1479 W Jacinto View Rd
- 1559 W Jacinto View Rd
- 1459 W Williams St
- 1581 W Williams St
- 1459 W Jacinto View Rd
- 1577 E Jacinto View Rd