
Seller's Agent in 2025
Kari Juhl
Lepic-Kroeger, REALTORS
(319) 541-3178
2 in this area
447 Total Sales
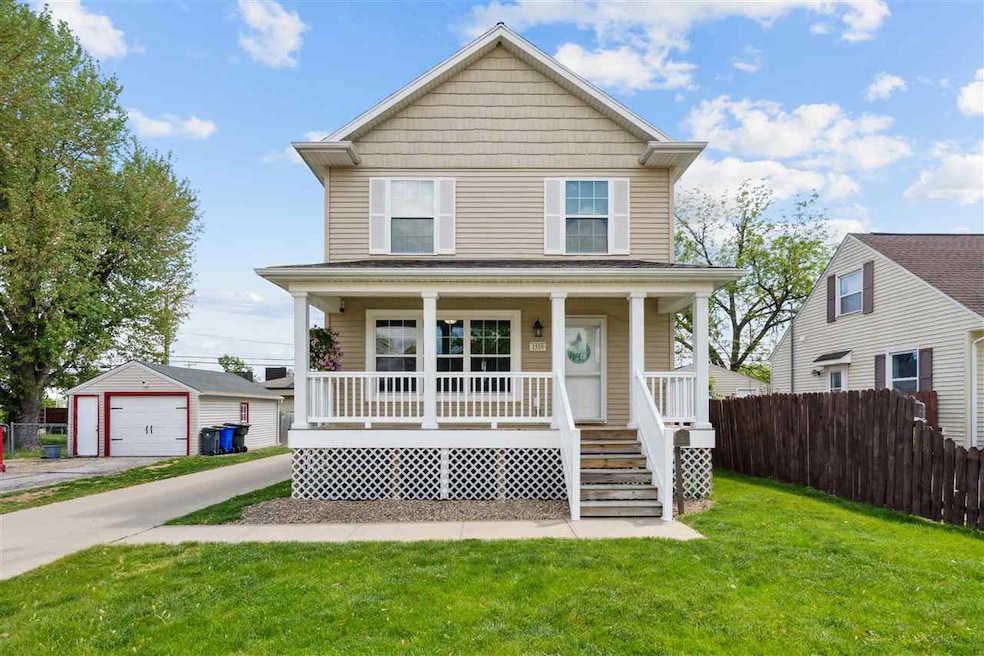
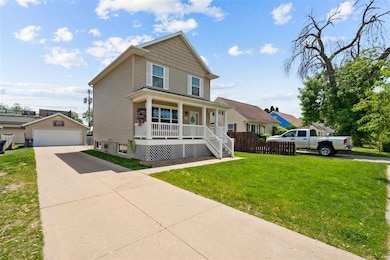
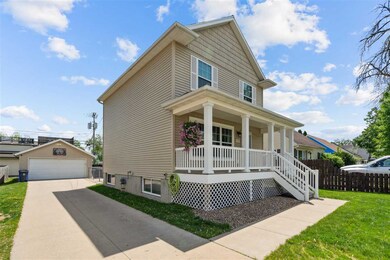
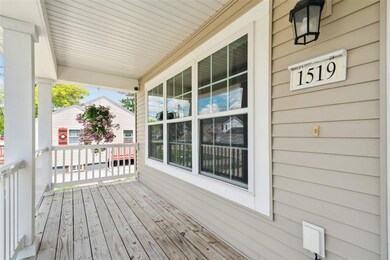
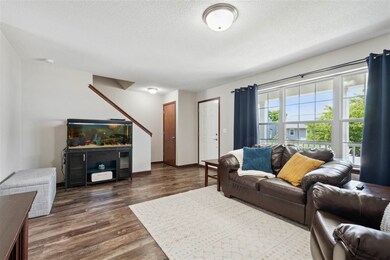
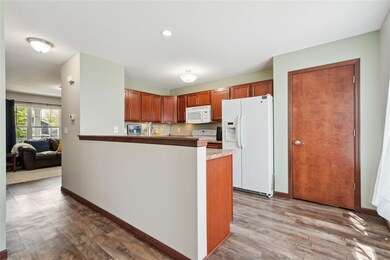
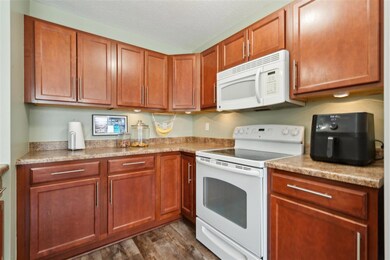
Welcome to this stunning single owner, 3 bedroom 1.5 bath 2 story home! Enjoy evenings on the expansive covered deck that extends across the front of the house. Inside you will discover a spacious living room with LVP flooring and fresh neutral paint throughout! The kitchen features ample cabinetry with stylish updated cabinet pulls, a large pantry and an adjoining dining room. Step outside to relax or grill on your patio in the fenced in back yard conveniently accessible from the dining room and kitchen! A half is also located on the main level for your convenience. Upstairs you will find three generous bedrooms, including the primary bedroom that features 2 closets and direct access to the upstairs bathroom. The lower level offers a versatile bonus living room/rec room, along with a large storage area and laundry room! An oversized two-stall detached garage completes this incredible home. Don't miss the chance to set up your private tour today!
| Date | Type | Sale Price | Title Company |
|---|---|---|---|
| Warranty Deed | $235,000 | None Listed On Document | |
| Warranty Deed | $235,000 | None Listed On Document | |
| Interfamily Deed Transfer | -- | None Available | |
| Warranty Deed | $139,000 | None Available | |
| Special Warranty Deed | $9,000 | None Available | |
| Joint Tenancy Deed | $66,000 | -- |
| Date | Status | Loan Amount | Loan Type |
|---|---|---|---|
| Open | $188,000 | New Conventional | |
| Closed | $188,000 | New Conventional | |
| Previous Owner | $104,435 | New Conventional | |
| Previous Owner | $66,462 | FHA |
| Date | Event | Price | List to Sale | Price per Sq Ft |
|---|---|---|---|---|
| 07/24/2025 07/24/25 | Sold | $235,000 | 0.0% | $150 / Sq Ft |
| 05/15/2025 05/15/25 | For Sale | $235,000 | -- | $150 / Sq Ft |
| Year | Tax Paid | Tax Assessment Tax Assessment Total Assessment is a certain percentage of the fair market value that is determined by local assessors to be the total taxable value of land and additions on the property. | Land | Improvement |
|---|---|---|---|---|
| 2025 | $3,692 | $208,300 | $30,200 | $178,100 |
| 2024 | $3,438 | $208,600 | $25,100 | $183,500 |
| 2023 | $3,438 | $208,600 | $25,100 | $183,500 |
| 2022 | $3,324 | $163,000 | $25,100 | $137,900 |
| 2021 | $3,270 | $160,500 | $22,600 | $137,900 |
| 2020 | $3,270 | $148,200 | $22,600 | $125,600 |
| 2019 | $3,290 | $152,600 | $20,100 | $132,500 |
| 2018 | $3,068 | $152,600 | $20,100 | $132,500 |
| 2017 | $3,068 | $137,500 | $20,100 | $117,400 |
| 2016 | $2,842 | $133,700 | $20,100 | $113,600 |
| 2015 | $2,842 | $133,440 | $20,117 | $113,323 |
| 2014 | $2,840 | $133,440 | $20,117 | $113,323 |
| 2013 | $2,708 | $133,440 | $20,117 | $113,323 |
Seller's Agent in 2025
Kari Juhl
Lepic-Kroeger, REALTORS
(319) 541-3178
2 in this area
447 Total Sales
R
Buyer's Agent in 2025
Ryan Bandy
Lepic-Kroeger, REALTORS
(563) 650-1812
4 in this area
174 Total Sales
Source: Iowa City Area Association of REALTORS®
MLS Number: 202503237
APN: 14201-51005-00000
Disclaimer: Certain information contained herein is derived from information provided by parties other than Homes.com. All information provided is deemed reliable, but is not guaranteed to be accurate and should be independently verified.
![]() IDX information is provided exclusively for consumers’ personal, non-commercial use, that it may not be used for any purpose other than to identify prospective properties consumers may be interested in purchasing.
IDX information is provided exclusively for consumers’ personal, non-commercial use, that it may not be used for any purpose other than to identify prospective properties consumers may be interested in purchasing.
Listing information is deemed reliable, but not guaranteed accurate by the MLS.