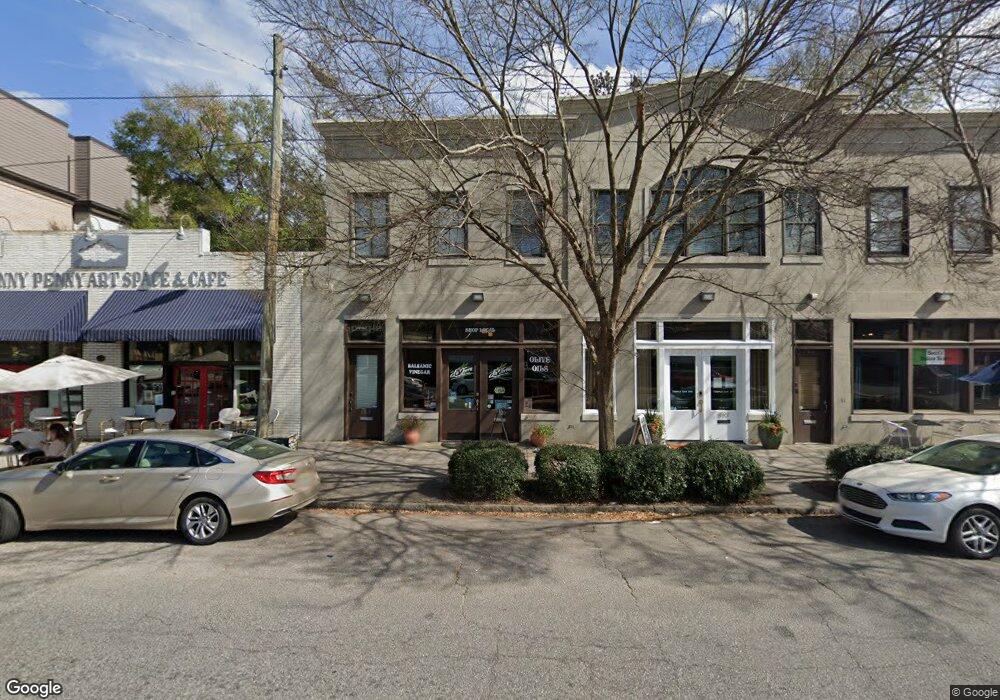
1519 Bull St Unit D Savannah, GA 31401
Thomas Square NeighborhoodEstimated Value: $472,849 - $537,000
2
Beds
2
Baths
1,071
Sq Ft
$471/Sq Ft
Est. Value
About This Home
This home is located at 1519 Bull St Unit D, Savannah, GA 31401 and is currently estimated at $504,212, approximately $470 per square foot. 1519 Bull St Unit D is a home located in Chatham County with nearby schools including Shuman Elementary School, Hubert Middle School, and Savannah Arts Academy.
Ownership History
Date
Name
Owned For
Owner Type
Purchase Details
Closed on
Mar 31, 2014
Sold by
Rutland Mark A
Bought by
Farmer Joseph B and Farmer Pamela D
Current Estimated Value
Home Financials for this Owner
Home Financials are based on the most recent Mortgage that was taken out on this home.
Original Mortgage
$159,000
Outstanding Balance
$126,142
Interest Rate
5.63%
Mortgage Type
Commercial
Estimated Equity
$378,070
Purchase Details
Closed on
Apr 18, 2006
Bought by
Rutland Mark A and Karen
Home Financials for this Owner
Home Financials are based on the most recent Mortgage that was taken out on this home.
Original Mortgage
$224,000
Interest Rate
6.28%
Mortgage Type
Commercial
Create a Home Valuation Report for This Property
The Home Valuation Report is an in-depth analysis detailing your home's value as well as a comparison with similar homes in the area
Home Values in the Area
Average Home Value in this Area
Purchase History
| Date | Buyer | Sale Price | Title Company |
|---|---|---|---|
| Farmer Joseph B | $212,000 | -- | |
| Rutland Mark A | $280,000 | -- |
Source: Public Records
Mortgage History
| Date | Status | Borrower | Loan Amount |
|---|---|---|---|
| Open | Farmer Joseph B | $159,000 | |
| Previous Owner | Rutland Mark A | $224,000 |
Source: Public Records
Tax History Compared to Growth
Tax History
| Year | Tax Paid | Tax Assessment Tax Assessment Total Assessment is a certain percentage of the fair market value that is determined by local assessors to be the total taxable value of land and additions on the property. | Land | Improvement |
|---|---|---|---|---|
| 2025 | $3,298 | $160,520 | $40,000 | $120,520 |
| 2024 | $3,298 | $121,080 | $40,000 | $81,080 |
| 2023 | $1,562 | $128,000 | $40,000 | $88,000 |
| 2022 | $1,451 | $118,960 | $40,000 | $78,960 |
| 2021 | $4,531 | $104,680 | $40,000 | $64,680 |
| 2020 | $3,030 | $104,040 | $40,000 | $64,040 |
| 2019 | $4,263 | $95,960 | $40,000 | $55,960 |
| 2018 | $2,982 | $94,440 | $40,000 | $54,440 |
| 2017 | $2,202 | $75,080 | $40,000 | $35,080 |
| 2016 | $2,211 | $75,800 | $40,000 | $35,800 |
| 2015 | $3,149 | $75,520 | $0 | $75,520 |
| 2014 | $6,120 | $110,560 | $0 | $0 |
Source: Public Records
Map
Nearby Homes
- 17 E 33rd St
- 18 E 34th St
- 111 E 31st St
- 110 W 31st St
- 108 E Anderson St Unit B
- 1313 Whitaker St
- 1718 Barnard St
- 21 Brady St
- 201 W 33rd St
- 124 Brady St
- 220 E 33rd St Unit A
- 1815 Barnard St
- 115 W 33rd St
- 421 W 31st St
- 20 W Duffy St Unit D
- 1321 Jefferson St
- 216 W Henry St
- 209 E Duffy St
- 302 E 35th St
- 213 E Duffy St
- 1518 Bull St
- 1524 Bull St Unit F
- 1524 Bull St Unit E
- 1524 Bull St Unit E
- 1524 Bull St
- 1520 Bull St
- 1520 Bull St Unit A
- 1522 Bull St Unit B
- 1514 Bull St
- 1526 Bull St
- 0 E 32nd St
- 0 E 32nd St Unit 7218325
- 10 E 32nd St
- 1512 Bull St
- 1512 Bull St
- 7 E 32nd St
- 9 E 32nd St Unit B
- 9 E 32nd St
- 11 E 32nd St Unit B
- 15 E 32nd St Unit A