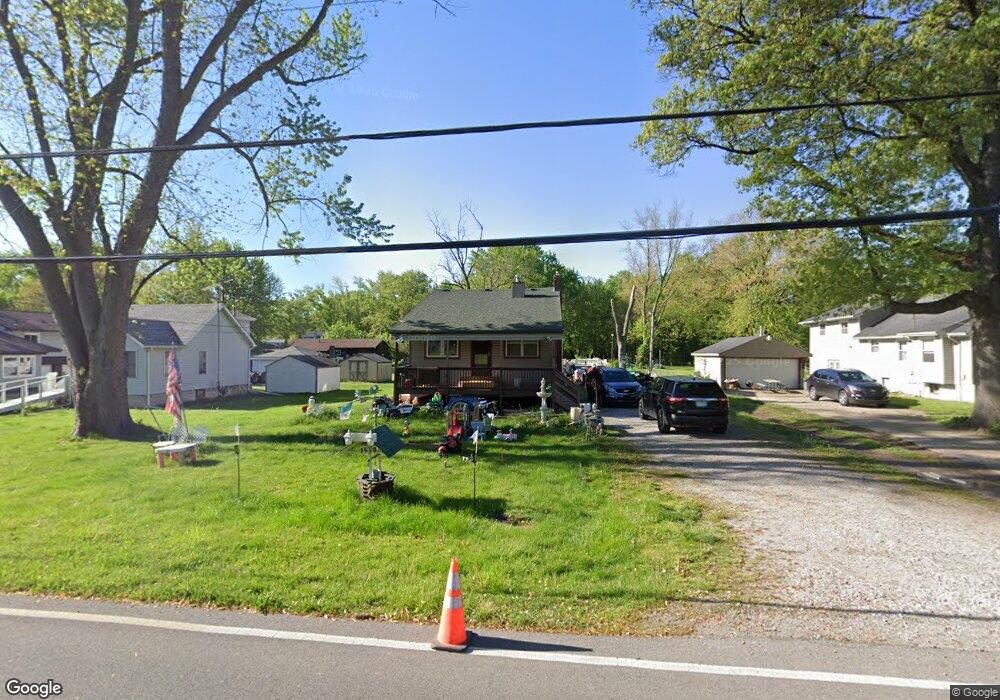
1519 E Elm St Griffith, IN 46319
Ross NeighborhoodEstimated Value: $165,000 - $245,000
3
Beds
2
Baths
2,092
Sq Ft
$98/Sq Ft
Est. Value
About This Home
This home is located at 1519 E Elm St, Griffith, IN 46319 and is currently estimated at $205,348, approximately $98 per square foot. 1519 E Elm St is a home located in Lake County with nearby schools including Calumet High School, St Mary School, and Calumet Christian School.
Ownership History
Date
Name
Owned For
Owner Type
Purchase Details
Closed on
Jun 20, 2016
Sold by
Sons Mark T and Sons Robert F
Bought by
Walker Rene and Walker Jonathan
Current Estimated Value
Home Financials for this Owner
Home Financials are based on the most recent Mortgage that was taken out on this home.
Original Mortgage
$125,582
Outstanding Balance
$98,894
Interest Rate
3.25%
Mortgage Type
FHA
Estimated Equity
$106,454
Purchase Details
Closed on
May 28, 2010
Sold by
Rzonca Brian D and Rzonca Christine
Bought by
Sons Mark T and Sons Robert F
Home Financials for this Owner
Home Financials are based on the most recent Mortgage that was taken out on this home.
Original Mortgage
$108,538
Interest Rate
4.25%
Mortgage Type
FHA
Purchase Details
Closed on
Aug 13, 2008
Sold by
Pietruszka Michael and Pietruszka Sandra
Bought by
Rzonca Brian D and Rzonca Christine
Home Financials for this Owner
Home Financials are based on the most recent Mortgage that was taken out on this home.
Original Mortgage
$72,826
Interest Rate
6.66%
Mortgage Type
FHA
Create a Home Valuation Report for This Property
The Home Valuation Report is an in-depth analysis detailing your home's value as well as a comparison with similar homes in the area
Home Values in the Area
Average Home Value in this Area
Purchase History
| Date | Buyer | Sale Price | Title Company |
|---|---|---|---|
| Walker Rene | -- | Community Title Co | |
| Sons Mark T | -- | Community Title Company | |
| Rzonca Brian D | -- | Community Title Company |
Source: Public Records
Mortgage History
| Date | Status | Borrower | Loan Amount |
|---|---|---|---|
| Open | Walker Rene | $125,582 | |
| Previous Owner | Sons Mark T | $108,538 | |
| Previous Owner | Rzonca Brian D | $72,826 |
Source: Public Records
Tax History
| Year | Tax Paid | Tax Assessment Tax Assessment Total Assessment is a certain percentage of the fair market value that is determined by local assessors to be the total taxable value of land and additions on the property. | Land | Improvement |
|---|---|---|---|---|
| 2025 | $1,464 | $164,800 | $20,300 | $144,500 |
| 2024 | $5,874 | $149,600 | $15,800 | $133,800 |
| 2023 | $1,379 | $137,900 | $15,800 | $122,100 |
| 2022 | $1,442 | $139,400 | $15,600 | $123,800 |
| 2021 | $1,337 | $128,300 | $15,600 | $112,700 |
| 2020 | $1,334 | $127,000 | $15,600 | $111,400 |
| 2019 | $1,406 | $124,900 | $14,900 | $110,000 |
| 2018 | $1,641 | $110,700 | $14,200 | $96,500 |
| 2017 | $1,512 | $106,000 | $14,200 | $91,800 |
| 2016 | $1,578 | $113,200 | $13,900 | $99,300 |
| 2014 | $1,240 | $107,800 | $14,200 | $93,600 |
| 2013 | $1,144 | $106,900 | $14,200 | $92,700 |
Source: Public Records
Map
Nearby Homes
- 706 N Colfax St
- 703 N Glenwood Ave
- 722 N Oakwood St
- 819 N Oakwood St
- 310 N Jay St
- 334 N Dwiggins St
- 225 N Dwiggins St
- 5706 W 43rd Ave
- 2014 E Elm St
- 4507 W 45th Ave
- 719 N Indiana St
- 1115 N Oakwood St
- 139 N Indiana St
- 415 N Wood St
- 902 N Wood St
- 1703 S Fairbanks St
- 4000 W 51st Ave
- 937 N Wood St
- 411 N Lafayette St
- 1218 N Glenwood Ave
- 1519 E Elm St
- 1523 E Elm St
- 1515 E Elm St
- 1525 E Elm (2 Homes) St
- 1525 E Elm St (2 Homes)
- 1525 E Elm St
- 1513 E Elm St
- 4902 Addison St
- 1507 E Elm St
- 1609 E Elm St
- 4908 Addison St
- 1503 E Elm St
- 4920-4922 Addison St
- 1813 E Elm St
- 4914 Addison St
- 1603 E Elm St
- 1501 E Elm St
- 4907 Addison St
- 1605 E Elm St
- 4915 Addison St
Your Personal Tour Guide
Ask me questions while you tour the home.