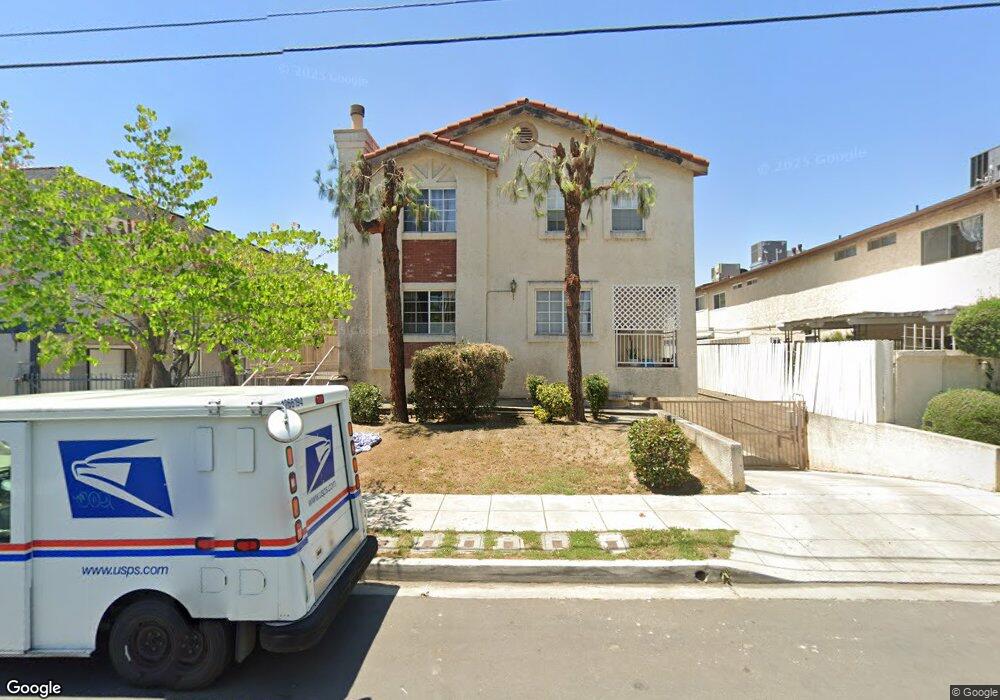
1519 Prospect Ave Unit 2 San Gabriel, CA 91776
Estimated Value: $753,170 - $842,000
3
Beds
2
Baths
1,442
Sq Ft
$548/Sq Ft
Est. Value
About This Home
This home is located at 1519 Prospect Ave Unit 2, San Gabriel, CA 91776 and is currently estimated at $789,543, approximately $547 per square foot. 1519 Prospect Ave Unit 2 is a home located in Los Angeles County with nearby schools including McKinley Elementary School, Jefferson Middle School, and Gabrielino High School.
Ownership History
Date
Name
Owned For
Owner Type
Purchase Details
Closed on
Aug 19, 2002
Sold by
Wang Geng
Bought by
Weng Adeline Zhi Hui
Current Estimated Value
Purchase Details
Closed on
Aug 8, 2002
Sold by
Wong Raymond and Leung Stella Yuk Fong
Bought by
Weng Adeline Zhi Hui
Purchase Details
Closed on
Oct 4, 2001
Sold by
Hwang Young Hun
Bought by
Wong Raymond
Home Financials for this Owner
Home Financials are based on the most recent Mortgage that was taken out on this home.
Original Mortgage
$180,000
Interest Rate
6.63%
Purchase Details
Closed on
Sep 1, 1998
Sold by
Leung Hon Keung
Bought by
Wong Raymond
Purchase Details
Closed on
Aug 30, 1995
Sold by
Wu Charles and Wu Ming H
Bought by
Leung Stella Yuk Fong
Home Financials for this Owner
Home Financials are based on the most recent Mortgage that was taken out on this home.
Original Mortgage
$180,100
Interest Rate
7.63%
Create a Home Valuation Report for This Property
The Home Valuation Report is an in-depth analysis detailing your home's value as well as a comparison with similar homes in the area
Home Values in the Area
Average Home Value in this Area
Purchase History
| Date | Buyer | Sale Price | Title Company |
|---|---|---|---|
| Weng Adeline Zhi Hui | -- | Ticor Title Company | |
| Weng Adeline Zhi Hui | $250,000 | Ticor Title | |
| Wong Raymond | -- | American Title Co | |
| Wong Raymond | -- | -- | |
| Leung Stella Yuk Fong | $212,000 | Stewart Title Company |
Source: Public Records
Mortgage History
| Date | Status | Borrower | Loan Amount |
|---|---|---|---|
| Previous Owner | Wong Raymond | $180,000 | |
| Previous Owner | Leung Stella Yuk Fong | $180,100 |
Source: Public Records
Tax History Compared to Growth
Tax History
| Year | Tax Paid | Tax Assessment Tax Assessment Total Assessment is a certain percentage of the fair market value that is determined by local assessors to be the total taxable value of land and additions on the property. | Land | Improvement |
|---|---|---|---|---|
| 2025 | $5,064 | $362,059 | $186,534 | $175,525 |
| 2024 | $5,064 | $354,961 | $182,877 | $172,084 |
| 2023 | $4,976 | $348,002 | $179,292 | $168,710 |
| 2022 | $4,772 | $341,179 | $175,777 | $165,402 |
| 2021 | $4,733 | $334,490 | $172,331 | $162,159 |
| 2019 | $4,530 | $324,570 | $167,220 | $157,350 |
| 2018 | $4,504 | $318,207 | $163,942 | $154,265 |
| 2016 | $4,284 | $305,853 | $157,577 | $148,276 |
| 2015 | $4,225 | $301,260 | $155,211 | $146,049 |
| 2014 | $4,190 | $295,360 | $152,171 | $143,189 |
Source: Public Records
Map
Nearby Homes
- 1506 Prospect Ave Unit B
- 1404 Prospect Ave Unit L
- 1309 Stevens Ave Unit C
- 518 W Bencamp St Unit B
- 1132 Azalea Dr
- 1122 Prospect Ave
- 999 E Valley Blvd Unit 114
- 1704 Azalea Dr
- 418 W Fairview Ave Unit D
- 777 E Valley Blvd Unit 123
- 777 E Valley Blvd Unit 125
- 777 E Valley Blvd
- 777 E Valley Blvd Unit 75
- 1015 Bilton Way
- 939 S Ramona St
- 1018 Palm Ave
- 7631 Columbia St
- 3436 Jackson Ave
- 1918 Denton Ave Unit E
- 2024 Brighton St
- 1519 Prospect Ave Unit 8
- 1519 Prospect Ave Unit E
- 1519 Prospect Ave
- 1519 Prospect Ave Unit 4
- 1519 Prospect Ave Unit 3
- 1519 Prospect Ave Unit 1
- 1515 Prospect Ave Unit A
- 1515 Prospect Ave
- 1515 Prospect Ave Unit E
- 1515 Prospect Ave Unit D
- 1515 Prospect Ave Unit C
- 1515 Prospect Ave Unit 2B
- 1511 Prospect Ave Unit K
- 1511 Prospect Ave Unit J
- 1511 Prospect Ave Unit H
- 1511 Prospect Ave Unit 7
- 1511 Prospect Ave Unit 6
- 412 W Newby Ave
- 1533 Prospect Ave Unit B
- 1533 Prospect Ave Unit C