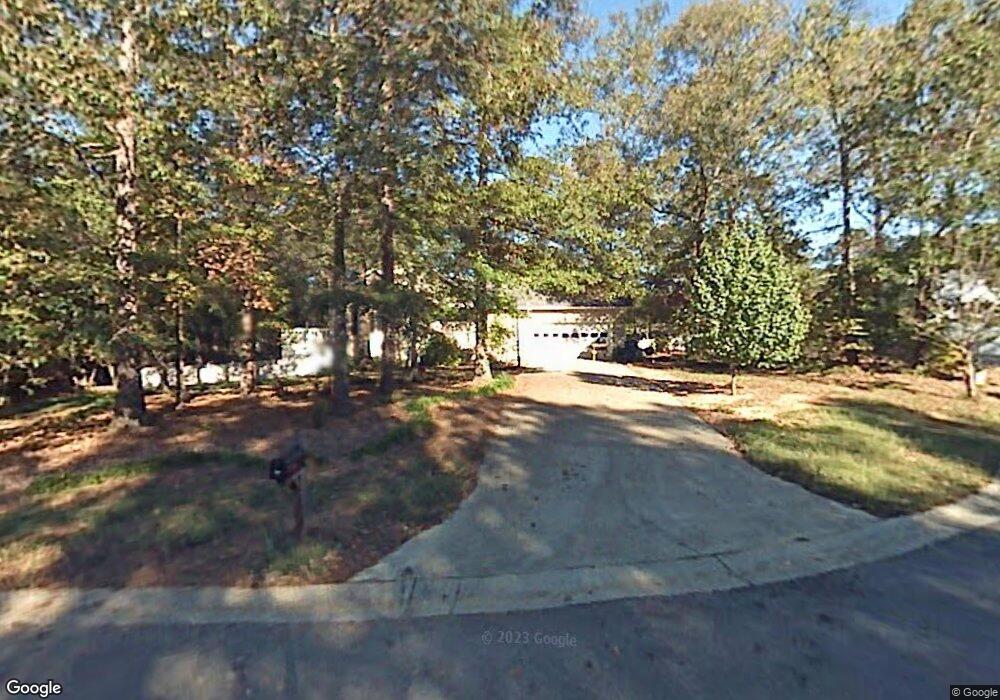
152 Ashmore Ct SE Calhoun, GA 30701
Estimated Value: $207,000 - $276,000
3
Beds
2
Baths
1,381
Sq Ft
$182/Sq Ft
Est. Value
About This Home
This home is located at 152 Ashmore Ct SE, Calhoun, GA 30701 and is currently estimated at $252,005, approximately $182 per square foot. 152 Ashmore Ct SE is a home located in Gordon County with nearby schools including Sonoraville Elementary School, Red Bud Middle School, and Sonoraville High School.
Ownership History
Date
Name
Owned For
Owner Type
Purchase Details
Closed on
Jan 26, 2018
Sold by
Bullard Jason
Bought by
Bullard Jason R and Bullard Marcy M
Current Estimated Value
Home Financials for this Owner
Home Financials are based on the most recent Mortgage that was taken out on this home.
Original Mortgage
$62,800
Outstanding Balance
$32,905
Interest Rate
3.99%
Mortgage Type
New Conventional
Estimated Equity
$219,100
Purchase Details
Closed on
Aug 29, 2003
Sold by
Secretary Of Housing & Urban D
Bought by
Bullard Jason A and Bullard K
Purchase Details
Closed on
Apr 1, 2003
Sold by
Mortgage Electronic Registrati
Bought by
Secretary Of Housing & Urban Development
Purchase Details
Closed on
May 15, 2002
Sold by
Houston Kyle S
Bought by
Mcmann Samuel Lester
Purchase Details
Closed on
Sep 5, 1997
Bought by
Houston Kyle S
Purchase Details
Closed on
May 7, 1993
Bought by
Mcdaniel Kimberly G
Purchase Details
Closed on
Oct 14, 1992
Bought by
Peed Tilman R
Create a Home Valuation Report for This Property
The Home Valuation Report is an in-depth analysis detailing your home's value as well as a comparison with similar homes in the area
Home Values in the Area
Average Home Value in this Area
Purchase History
| Date | Buyer | Sale Price | Title Company |
|---|---|---|---|
| Bullard Jason R | -- | -- | |
| Bullard Jason A | -- | -- | |
| Secretary Of Housing & Urban Development | -- | -- | |
| Mortgage Electronic Registration Sys | -- | -- | |
| Mcmann Samuel Lester | $103,000 | -- | |
| Houston Kyle S | $87,000 | -- | |
| Mcdaniel Kimberly G | $74,500 | -- | |
| Peed Tilman R | $71,500 | -- |
Source: Public Records
Mortgage History
| Date | Status | Borrower | Loan Amount |
|---|---|---|---|
| Open | Bullard Jason R | $62,800 |
Source: Public Records
Tax History Compared to Growth
Tax History
| Year | Tax Paid | Tax Assessment Tax Assessment Total Assessment is a certain percentage of the fair market value that is determined by local assessors to be the total taxable value of land and additions on the property. | Land | Improvement |
|---|---|---|---|---|
| 2024 | $1,948 | $76,680 | $6,800 | $69,880 |
| 2023 | $1,829 | $72,000 | $6,800 | $65,200 |
| 2022 | $1,824 | $67,520 | $6,800 | $60,720 |
| 2021 | $1,367 | $48,800 | $6,800 | $42,000 |
| 2020 | $1,351 | $47,160 | $5,600 | $41,560 |
| 2019 | $1,370 | $47,548 | $5,600 | $41,948 |
| 2018 | $1,401 | $48,640 | $5,600 | $43,040 |
| 2017 | $1,374 | $46,360 | $5,600 | $40,760 |
| 2016 | $1,269 | $42,720 | $5,600 | $37,120 |
| 2015 | $1,260 | $42,040 | $5,600 | $36,440 |
| 2014 | $1,203 | $41,313 | $5,600 | $35,713 |
Source: Public Records
Map
Nearby Homes
- 166 Woodford Way SE
- 190 Woodford Way SE
- 145 Water Wheel Ln SE
- 135 Grist Mill Ln SE
- 140 Grist Mill Ln SE
- 311 Langston Rd SE
- 157 Asbury Cir
- Grand Bahama Plan at Heritage Grove - 2-Story
- Anderson Plan at Heritage Grove - 2-Story
- Aruba Bay Plan at Heritage Grove - 2-Story
- Allegheny Plan at Heritage Grove - 2-Story
- Hudson Plan at Heritage Grove - 2-Story
- Eden Cay Plan at Heritage Grove - 2-Story
- Ballenger Plan at Heritage Grove - 2-Story
- The Bradley Plan at Saddle Ridge
- The James Plan at Saddle Ridge
- The Caldwell Plan at Saddle Ridge
- The Avondale Plan at Saddle Ridge
- The McGinnis Plan at Saddle Ridge
- The Crawford Plan at Saddle Ridge
- 126 Ashmore Ct SE
- 160 Ashmore Ct SE
- 143 Hanover Cir SE
- 151 Ashmore Ct SE
- 129 Hanover Cir SE
- 159 Ashmore Ct SE
- 157 Hanover Cir SE
- 117 Hanover Cir SE
- 127 Ashmore Ct SE
- 106 Ashmore Ct SE
- 171 Hanover Cir SE
- 195 Hanover Cir SE
- 223 Hanover Cir SE
- 105 Hanover Cir SE
- 231 Hanover Cir SE
- 230 Beason Rd SE
- 152 Hanover Cir SE
- 239 Hanover Cir SE
- 128 Hanover Cir SE
- 248 Beason Rd SE