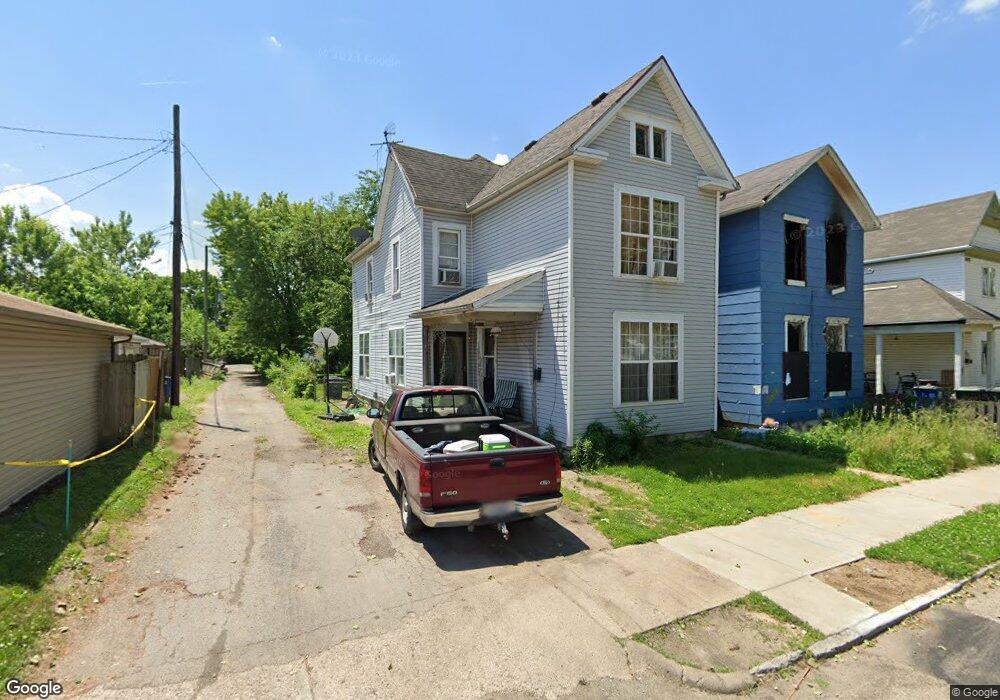
152 Bierce Ave Dayton, OH 45403
Burkhardt NeighborhoodEstimated Value: $95,000 - $134,000
3
Beds
2
Baths
1,652
Sq Ft
$69/Sq Ft
Est. Value
About This Home
This home is located at 152 Bierce Ave, Dayton, OH 45403 and is currently estimated at $113,836, approximately $68 per square foot. 152 Bierce Ave is a home located in Montgomery County with nearby schools including Ruskin Elementary School, Kiser Elementary, and Horizon Science Academy Dayton Downtown.
Ownership History
Date
Name
Owned For
Owner Type
Purchase Details
Closed on
Jan 23, 2003
Sold by
Wadsworth Robert and Wadsworth William
Bought by
Campbell S Scott
Current Estimated Value
Purchase Details
Closed on
Oct 4, 2002
Sold by
Mount Randy
Bought by
Swc Estates and Wadsworth Robert
Purchase Details
Closed on
Sep 10, 2002
Sold by
Mayse Steven D
Bought by
Nationscredit Financial Services Corp
Purchase Details
Closed on
Sep 4, 2002
Sold by
Nationscredit Financial Services Corp
Bought by
Mount Randy
Purchase Details
Closed on
Apr 26, 2002
Sold by
Mayse Steven D
Bought by
Nationscredit Financial Services Corp
Purchase Details
Closed on
Apr 27, 2001
Sold by
K & D Home Specialists Llc
Bought by
Mayse Steven D
Purchase Details
Closed on
Jan 14, 1999
Sold by
First Value Corp
Bought by
Mayse Steven D
Home Financials for this Owner
Home Financials are based on the most recent Mortgage that was taken out on this home.
Original Mortgage
$50,000
Interest Rate
9.12%
Create a Home Valuation Report for This Property
The Home Valuation Report is an in-depth analysis detailing your home's value as well as a comparison with similar homes in the area
Home Values in the Area
Average Home Value in this Area
Purchase History
| Date | Buyer | Sale Price | Title Company |
|---|---|---|---|
| Campbell S Scott | $9,000 | -- | |
| Swc Estates | -- | -- | |
| Nationscredit Financial Services Corp | $30,000 | -- | |
| Mount Randy | $10,000 | Accutitle Agency Inc | |
| Nationscredit Financial Services Corp | $30,000 | Accutitle Agency Inc | |
| Mayse Steven D | -- | -- | |
| Mayse Steven D | $62,500 | -- |
Source: Public Records
Mortgage History
| Date | Status | Borrower | Loan Amount |
|---|---|---|---|
| Previous Owner | Mayse Steven D | $50,000 |
Source: Public Records
Tax History
| Year | Tax Paid | Tax Assessment Tax Assessment Total Assessment is a certain percentage of the fair market value that is determined by local assessors to be the total taxable value of land and additions on the property. | Land | Improvement |
|---|---|---|---|---|
| 2025 | $739 | $12,240 | $1,770 | $10,470 |
| 2024 | $720 | $12,240 | $1,770 | $10,470 |
| 2023 | $720 | $12,240 | $1,770 | $10,470 |
| 2022 | $811 | $10,700 | $1,550 | $9,150 |
| 2021 | $807 | $10,700 | $1,550 | $9,150 |
| 2020 | $805 | $10,700 | $1,550 | $9,150 |
| 2019 | $779 | $9,250 | $1,550 | $7,700 |
| 2018 | $780 | $9,250 | $1,550 | $7,700 |
| 2017 | $774 | $9,250 | $1,550 | $7,700 |
| 2016 | $844 | $9,630 | $1,550 | $8,080 |
| 2015 | $799 | $9,630 | $1,550 | $8,080 |
| 2014 | $799 | $9,630 | $1,550 | $8,080 |
| 2012 | -- | $12,900 | $2,990 | $9,910 |
Source: Public Records
Map
Nearby Homes
- 150 Bierce Ave
- 146 Bierce Ave
- 255 S Findlay St
- 251 S Findlay St
- 261 S Findlay St
- 265 S Findlay St
- 138 Bierce Ave
- 249 S Findlay St
- 267 S Findlay St
- 134 Bierce Ave
- 243 S Findlay St
- 271 S Findlay St
- 130 Bierce Ave
- 239 S Findlay St
- 128 Bierce Ave
- 157 Bierce Ave
- 275 S Findlay St
- 126 Bierce Ave
- 235 S Findlay St
- 258 S Findlay St