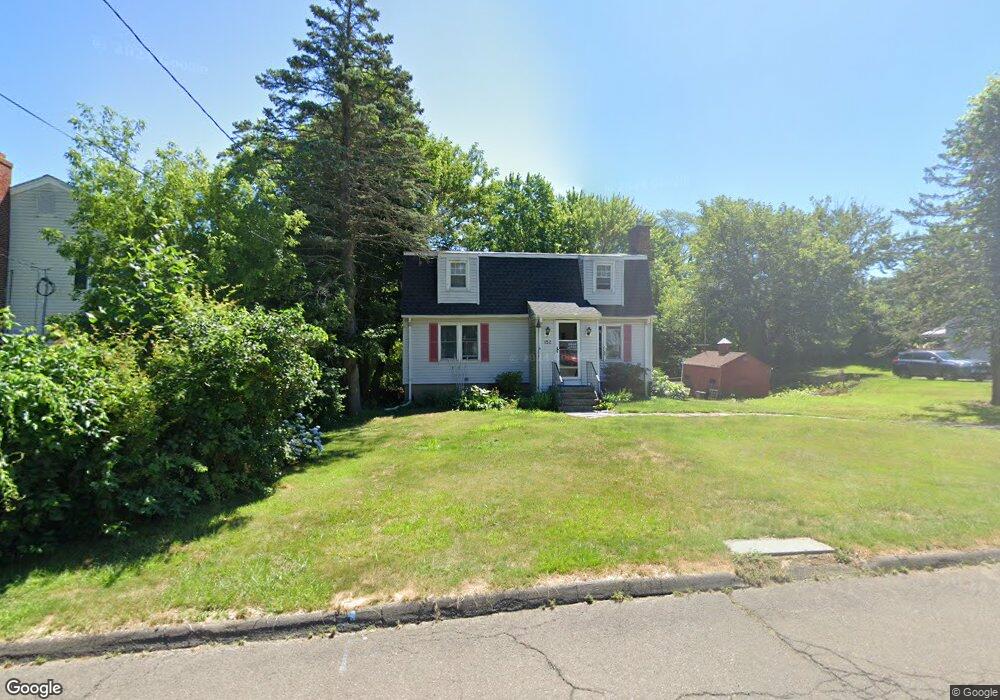
152 Henry St Windsor, CT 06095
Estimated Value: $207,000 - $307,000
3
Beds
3
Baths
1,540
Sq Ft
$179/Sq Ft
Est. Value
About This Home
This home is located at 152 Henry St, Windsor, CT 06095 and is currently estimated at $276,100, approximately $179 per square foot. 152 Henry St is a home located in Hartford County with nearby schools including Oliver Ellsworth School, John F. Kennedy School, and Sage Park Middle School.
Ownership History
Date
Name
Owned For
Owner Type
Purchase Details
Closed on
Jul 31, 2024
Sold by
Tomasky Jessica
Bought by
Belval Diane
Current Estimated Value
Home Financials for this Owner
Home Financials are based on the most recent Mortgage that was taken out on this home.
Original Mortgage
$97,000
Outstanding Balance
$95,726
Interest Rate
6.87%
Mortgage Type
Purchase Money Mortgage
Estimated Equity
$180,374
Purchase Details
Closed on
Mar 1, 2004
Sold by
Tierney Mary Ann Est and Tierney
Bought by
Tomasky Jessica
Home Financials for this Owner
Home Financials are based on the most recent Mortgage that was taken out on this home.
Original Mortgage
$121,250
Interest Rate
6.25%
Mortgage Type
Purchase Money Mortgage
Create a Home Valuation Report for This Property
The Home Valuation Report is an in-depth analysis detailing your home's value as well as a comparison with similar homes in the area
Home Values in the Area
Average Home Value in this Area
Purchase History
| Date | Buyer | Sale Price | Title Company |
|---|---|---|---|
| Belval Diane | $165,000 | None Available | |
| Belval Diane | $165,000 | None Available | |
| Tomasky Jessica | $125,000 | -- | |
| Tomasky Jessica | $125,000 | -- |
Source: Public Records
Mortgage History
| Date | Status | Borrower | Loan Amount |
|---|---|---|---|
| Open | Belval Diane | $97,000 | |
| Closed | Belval Diane | $97,000 | |
| Previous Owner | Tomasky Jessica | $180,000 | |
| Previous Owner | Tomasky Jessica | $121,250 |
Source: Public Records
Tax History
| Year | Tax Paid | Tax Assessment Tax Assessment Total Assessment is a certain percentage of the fair market value that is determined by local assessors to be the total taxable value of land and additions on the property. | Land | Improvement |
|---|---|---|---|---|
| 2025 | $5,080 | $178,570 | $52,430 | $126,140 |
| 2024 | $5,414 | $178,570 | $52,430 | $126,140 |
| 2023 | $4,088 | $121,660 | $36,610 | $85,050 |
| 2022 | $4,048 | $121,660 | $36,610 | $85,050 |
| 2021 | $4,048 | $121,660 | $36,610 | $85,050 |
| 2020 | $4,028 | $121,660 | $36,610 | $85,050 |
| 2019 | $3,939 | $121,660 | $36,610 | $85,050 |
| 2018 | $3,860 | $117,110 | $36,610 | $80,500 |
| 2017 | $3,800 | $117,110 | $36,610 | $80,500 |
| 2016 | $3,691 | $117,110 | $36,610 | $80,500 |
| 2015 | $3,721 | $120,330 | $36,610 | $83,720 |
| 2014 | $3,666 | $120,330 | $36,610 | $83,720 |
Source: Public Records
Map
Nearby Homes
Your Personal Tour Guide
Ask me questions while you tour the home.