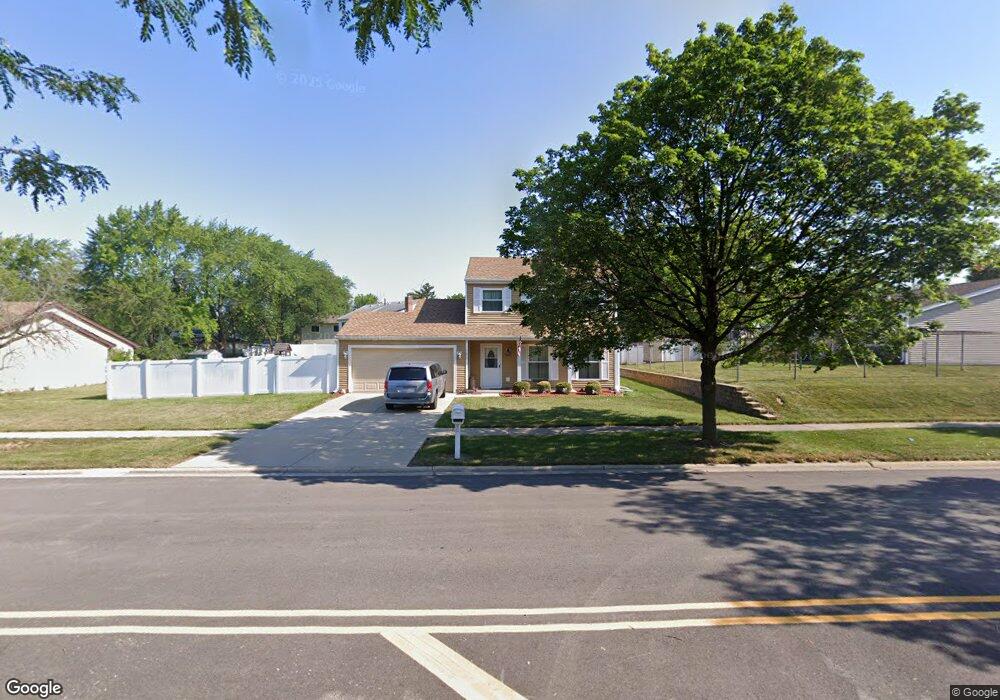
152 Lee Ln Unit 1A Bolingbrook, IL 60440
East Bolingbrook NeighborhoodEstimated Value: $318,050 - $324,000
3
Beds
2
Baths
1,580
Sq Ft
$203/Sq Ft
Est. Value
About This Home
This home is located at 152 Lee Ln Unit 1A, Bolingbrook, IL 60440 and is currently estimated at $321,263, approximately $203 per square foot. 152 Lee Ln Unit 1A is a home located in Will County with nearby schools including Oak View Elementary School, Brooks Middle School, and Bolingbrook High School.
Ownership History
Date
Name
Owned For
Owner Type
Purchase Details
Closed on
Aug 15, 2011
Sold by
Ward Barry and Ward Christine
Bought by
Karesh Lance S and Karesh Margaret C
Current Estimated Value
Home Financials for this Owner
Home Financials are based on the most recent Mortgage that was taken out on this home.
Original Mortgage
$145,350
Outstanding Balance
$100,545
Interest Rate
4.55%
Mortgage Type
New Conventional
Estimated Equity
$220,718
Purchase Details
Closed on
Apr 22, 2011
Sold by
Hsbc Bank Usa Na
Bought by
Ward Barry
Purchase Details
Closed on
Oct 12, 2010
Sold by
Paz Thelma and Case #09 Ch 5014
Bought by
Hsbc Bank Usa N A
Purchase Details
Closed on
Mar 1, 2006
Sold by
Standard Bank & Trust Co
Bought by
Paz Thelma D
Home Financials for this Owner
Home Financials are based on the most recent Mortgage that was taken out on this home.
Original Mortgage
$156,000
Interest Rate
8.65%
Mortgage Type
Balloon
Purchase Details
Closed on
Feb 18, 2003
Sold by
Preze Theresa L
Bought by
Standard Bank & Trust Co and Trust #17598
Create a Home Valuation Report for This Property
The Home Valuation Report is an in-depth analysis detailing your home's value as well as a comparison with similar homes in the area
Home Values in the Area
Average Home Value in this Area
Purchase History
| Date | Buyer | Sale Price | Title Company |
|---|---|---|---|
| Karesh Lance S | $153,000 | None Available | |
| Ward Barry | $64,199 | None Available | |
| Hsbc Bank Usa N A | $134,907 | None Available | |
| Paz Thelma D | $195,000 | Law Title Joliet | |
| Standard Bank & Trust Co | -- | -- |
Source: Public Records
Mortgage History
| Date | Status | Borrower | Loan Amount |
|---|---|---|---|
| Open | Karesh Lance S | $145,350 | |
| Previous Owner | Paz Thelma D | $156,000 |
Source: Public Records
Tax History
| Year | Tax Paid | Tax Assessment Tax Assessment Total Assessment is a certain percentage of the fair market value that is determined by local assessors to be the total taxable value of land and additions on the property. | Land | Improvement |
|---|---|---|---|---|
| 2024 | $8,269 | $97,535 | $20,376 | $77,159 |
| 2023 | $8,269 | $87,759 | $18,334 | $69,425 |
| 2022 | $7,074 | $77,568 | $16,205 | $61,363 |
| 2021 | $6,698 | $72,527 | $15,152 | $57,375 |
| 2020 | $6,488 | $70,142 | $14,654 | $55,488 |
| 2019 | $6,273 | $66,802 | $13,956 | $52,846 |
| 2018 | $5,823 | $62,064 | $12,967 | $49,097 |
| 2017 | $5,537 | $58,828 | $12,291 | $46,537 |
| 2016 | $5,369 | $56,000 | $11,700 | $44,300 |
| 2015 | $5,294 | $53,700 | $11,200 | $42,500 |
| 2014 | $5,294 | $53,700 | $11,200 | $42,500 |
| 2013 | $5,294 | $53,700 | $11,200 | $42,500 |
Source: Public Records
Map
Nearby Homes
- 226 Grant Dr
- 127 Monticello Cir
- 112 Brook Ct
- 230 Delaware Dr
- 103 Enclave Cir Unit C
- 145 Enclave Cir Unit D
- 141 W Robinhood Way Unit 141
- 265 Cobb Cir
- 369 Lakeview Cir
- 140 Enclave Cir Unit C
- 419 Lakeview Cir
- 13 Marywood Ln Unit C
- 196 Hadleigh Rd
- 80 Fernwood Dr Unit O
- 125 Monterey Dr
- 234 Malibu Dr
- 5 E Fernwood Dr
- 153 Camelot Way
- 372 Windsong Ct Unit 4110
- 10 Fernwood Dr Unit L
Your Personal Tour Guide
Ask me questions while you tour the home.