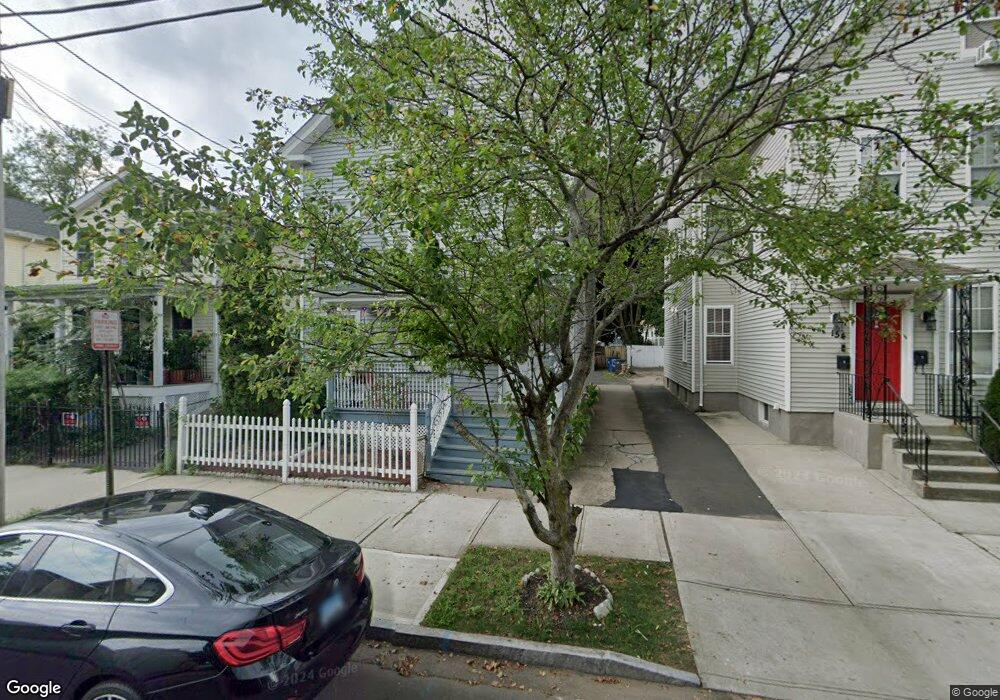
152 Lloyd St New Haven, CT 06513
Fair Haven NeighborhoodEstimated Value: $340,311 - $396,000
5
Beds
3
Baths
2,215
Sq Ft
$172/Sq Ft
Est. Value
About This Home
This home is located at 152 Lloyd St, New Haven, CT 06513 and is currently estimated at $380,578, approximately $171 per square foot. 152 Lloyd St is a home located in New Haven County with nearby schools including Elm City College Preparatory School, Cold Spring School, and St Francis & St Rose Of Lima School.
Ownership History
Date
Name
Owned For
Owner Type
Purchase Details
Closed on
Jan 30, 2002
Sold by
Fair Haven Dev Corp
Bought by
Santiago Angel L
Current Estimated Value
Home Financials for this Owner
Home Financials are based on the most recent Mortgage that was taken out on this home.
Original Mortgage
$94,400
Outstanding Balance
$38,472
Interest Rate
7.15%
Estimated Equity
$342,106
Purchase Details
Closed on
Jun 30, 2000
Sold by
Peoples Bank
Bought by
Fair Haven Dev Corp
Create a Home Valuation Report for This Property
The Home Valuation Report is an in-depth analysis detailing your home's value as well as a comparison with similar homes in the area
Home Values in the Area
Average Home Value in this Area
Purchase History
| Date | Buyer | Sale Price | Title Company |
|---|---|---|---|
| Santiago Angel L | $125,000 | -- | |
| Fair Haven Dev Corp | $23,000 | -- |
Source: Public Records
Mortgage History
| Date | Status | Borrower | Loan Amount |
|---|---|---|---|
| Closed | Fair Haven Dev Corp | $35,000 | |
| Open | Fair Haven Dev Corp | $94,400 | |
| Previous Owner | Fair Haven Dev Corp | $125,000 | |
| Previous Owner | Fair Haven Dev Corp | $102,500 |
Source: Public Records
Tax History Compared to Growth
Tax History
| Year | Tax Paid | Tax Assessment Tax Assessment Total Assessment is a certain percentage of the fair market value that is determined by local assessors to be the total taxable value of land and additions on the property. | Land | Improvement |
|---|---|---|---|---|
| 2025 | $6,365 | $161,560 | $38,150 | $123,410 |
| 2024 | $6,220 | $161,560 | $38,150 | $123,410 |
| 2023 | $6,010 | $161,560 | $38,150 | $123,410 |
| 2022 | $6,422 | $161,560 | $38,150 | $123,410 |
| 2021 | $4,094 | $93,310 | $30,520 | $62,790 |
| 2020 | $4,094 | $93,310 | $30,520 | $62,790 |
| 2019 | $4,010 | $93,310 | $30,520 | $62,790 |
| 2018 | $4,010 | $93,310 | $30,520 | $62,790 |
| 2017 | $3,609 | $93,310 | $30,520 | $62,790 |
| 2016 | $2,786 | $67,060 | $13,860 | $53,200 |
| 2015 | $2,786 | $67,060 | $13,860 | $53,200 |
| 2014 | $2,786 | $67,060 | $13,860 | $53,200 |
Source: Public Records
Map
Nearby Homes
- 187 Saltonstall Ave
- 213 Saltonstall Ave
- 83 James St
- 114 Blatchley Ave
- 56 Woolsey St
- 181 James St
- 111 Chapel St
- 35 Saltonstall Ave
- 36 Shelter St
- 295 Lloyd St
- 85 Pierpont St
- 191 Ferry St
- 115 Clay St
- 308 Poplar St
- 72 Pierpont St
- 74 Fillmore St
- 33 Chapel St
- 32 E Pearl St
- 1 Front St Unit 1 Kel
- 43 E Pearl St