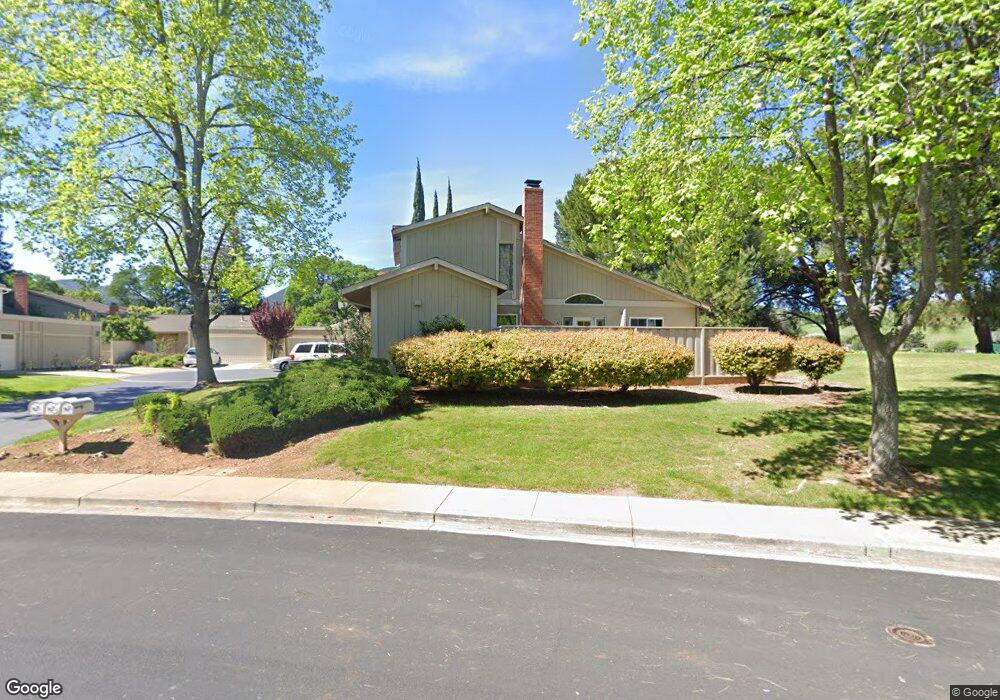
152 Mt Etna Dr Clayton, CA 94517
Estimated Value: $615,000 - $804,000
3
Beds
2
Baths
1,310
Sq Ft
$543/Sq Ft
Est. Value
About This Home
This home is located at 152 Mt Etna Dr, Clayton, CA 94517 and is currently estimated at $711,296, approximately $542 per square foot. 152 Mt Etna Dr is a home located in Contra Costa County with nearby schools including Mt. Diablo Elementary School, Diablo View Middle School, and College Park High School.
Ownership History
Date
Name
Owned For
Owner Type
Purchase Details
Closed on
Apr 23, 2012
Sold by
Colladay Jon
Bought by
Fung Frederick Lik Yan and Fung Melva Nim Chi
Current Estimated Value
Purchase Details
Closed on
Jun 7, 2007
Sold by
Colladay Jon and Colladay Jonathan
Bought by
Colladay Jon
Home Financials for this Owner
Home Financials are based on the most recent Mortgage that was taken out on this home.
Original Mortgage
$393,000
Interest Rate
6.75%
Mortgage Type
New Conventional
Purchase Details
Closed on
Oct 6, 1993
Sold by
Grover Manmohan Singh and Yates Barbara B
Bought by
Colladay Jonathan
Home Financials for this Owner
Home Financials are based on the most recent Mortgage that was taken out on this home.
Original Mortgage
$129,200
Interest Rate
3.95%
Mortgage Type
Purchase Money Mortgage
Create a Home Valuation Report for This Property
The Home Valuation Report is an in-depth analysis detailing your home's value as well as a comparison with similar homes in the area
Home Values in the Area
Average Home Value in this Area
Purchase History
| Date | Buyer | Sale Price | Title Company |
|---|---|---|---|
| Fung Frederick Lik Yan | $250,000 | Old Republic Title Company | |
| Colladay Jon | -- | Ticor Title Co Of California | |
| Colladay Jonathan | $161,500 | First American Title Co |
Source: Public Records
Mortgage History
| Date | Status | Borrower | Loan Amount |
|---|---|---|---|
| Previous Owner | Colladay Jon | $393,000 | |
| Previous Owner | Colladay Jonathan | $129,200 |
Source: Public Records
Tax History Compared to Growth
Tax History
| Year | Tax Paid | Tax Assessment Tax Assessment Total Assessment is a certain percentage of the fair market value that is determined by local assessors to be the total taxable value of land and additions on the property. | Land | Improvement |
|---|---|---|---|---|
| 2025 | $4,650 | $314,003 | $56,518 | $257,485 |
| 2024 | $4,545 | $307,847 | $55,410 | $252,437 |
| 2023 | $4,545 | $301,812 | $54,324 | $247,488 |
| 2022 | $4,464 | $295,895 | $53,259 | $242,636 |
| 2021 | $4,340 | $290,094 | $52,215 | $237,879 |
| 2019 | $4,242 | $281,491 | $50,667 | $230,824 |
| 2018 | $4,075 | $275,973 | $49,674 | $226,299 |
| 2017 | $3,930 | $270,562 | $48,700 | $221,862 |
| 2016 | $3,804 | $265,258 | $47,746 | $217,512 |
| 2015 | $3,737 | $261,274 | $47,029 | $214,245 |
| 2014 | $3,652 | $256,157 | $46,108 | $210,049 |
Source: Public Records
Map
Nearby Homes
- 5872 Herriman Dr
- 20 Mt Tamalpais Place
- 9 Herriman Ct
- 23 Mt Wilson Way
- 4 Mt Wilson Way
- 186 Mt Wilson Way
- 11 Donner Creek Ct
- 5900 High St
- 1170 Ridgemont Place
- 785 Bloching Cir
- 1224 Easley Dr
- 308 Mountaire Pkwy
- 33 El Molino Dr
- 5665 Lewis Way
- 1338 Shell Ln
- 1343 Shell Ln
- 1295 Shell Cir Unit 1
- 1 Petar Ct
- 1039 Feather Cir
- 1181 Blue Lake Way
- 156 Mount Etna Dr
- 156 Mt Etna Dr
- 172 Mt Etna Dr
- 160 Mt Etna Dr
- 168 Mt Etna Dr
- 164 Mt Etna Dr
- 153 Mt Etna Dr
- 144 Mt Etna Dr
- 148 Mt Etna Dr
- 161 Mt Etna Dr
- 595 Mt Dell Dr
- 157 Mt Etna Dr
- 597 Mt Dell Dr
- 140 Mt Etna Dr
- 149 Mt Etna Dr
- 593 Mt Dell Dr
- 599 Mt Dell Dr
- 248 Mountaire Cir
- 136 Mt Etna Dr
- 246 Mountaire Cir