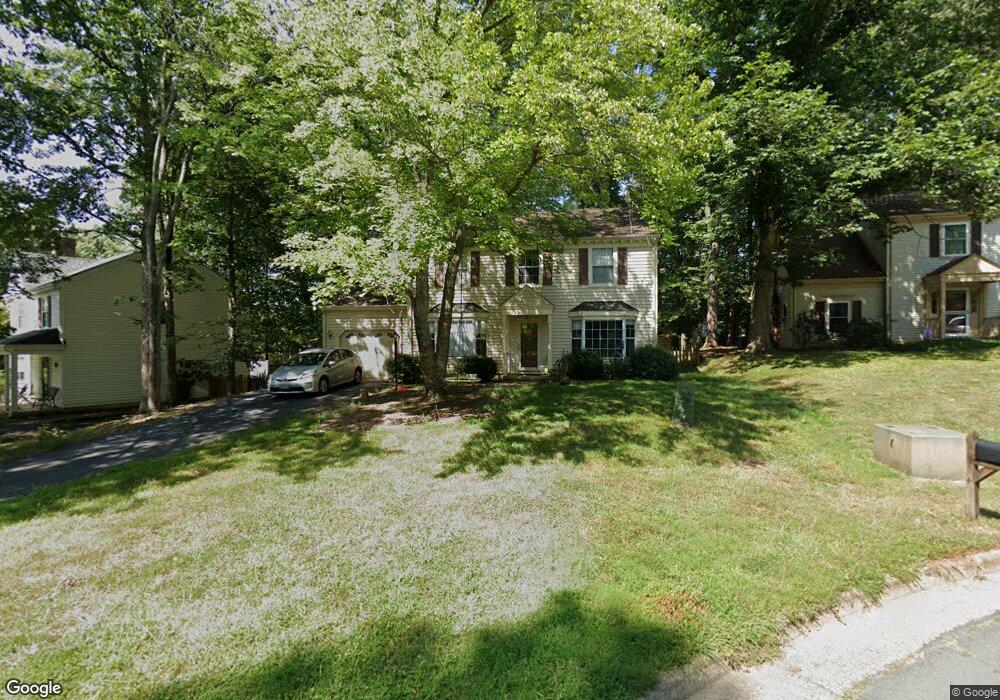
152 Olton Place Charlottesville, VA 22902
Southeast Charlottesville NeighborhoodEstimated Value: $489,000 - $548,000
4
Beds
3
Baths
2,022
Sq Ft
$256/Sq Ft
Est. Value
About This Home
This home is located at 152 Olton Place, Charlottesville, VA 22902 and is currently estimated at $517,053, approximately $255 per square foot. 152 Olton Place is a home located in Albemarle County with nearby schools including Mountain View Elementary School, Jackson P. Burley Middle School, and Monticello High School.
Ownership History
Date
Name
Owned For
Owner Type
Purchase Details
Closed on
May 17, 2021
Sold by
Seawell Rose Ann G
Bought by
Chamberlin Christopher A and Chamberlin Lori A
Current Estimated Value
Home Financials for this Owner
Home Financials are based on the most recent Mortgage that was taken out on this home.
Original Mortgage
$381,900
Outstanding Balance
$346,097
Interest Rate
3.1%
Mortgage Type
New Conventional
Estimated Equity
$170,956
Create a Home Valuation Report for This Property
The Home Valuation Report is an in-depth analysis detailing your home's value as well as a comparison with similar homes in the area
Home Values in the Area
Average Home Value in this Area
Purchase History
| Date | Buyer | Sale Price | Title Company |
|---|---|---|---|
| Chamberlin Christopher A | $402,000 | Chicago Title Insurance Co |
Source: Public Records
Mortgage History
| Date | Status | Borrower | Loan Amount |
|---|---|---|---|
| Open | Chamberlin Christopher A | $381,900 |
Source: Public Records
Tax History
| Year | Tax Paid | Tax Assessment Tax Assessment Total Assessment is a certain percentage of the fair market value that is determined by local assessors to be the total taxable value of land and additions on the property. | Land | Improvement |
|---|---|---|---|---|
| 2025 | $4,115 | $460,300 | $145,000 | $315,300 |
| 2024 | $3,647 | $427,100 | $134,000 | $293,100 |
| 2023 | $3,486 | $408,200 | $130,000 | $278,200 |
| 2022 | $3,397 | $397,800 | $130,000 | $267,800 |
| 2021 | $3,156 | $369,500 | $130,000 | $239,500 |
| 2020 | $3,150 | $368,800 | $135,000 | $233,800 |
| 2019 | $2,584 | $302,600 | $125,000 | $177,600 |
| 2018 | $2,353 | $287,200 | $125,000 | $162,200 |
| 2017 | $2,297 | $273,800 | $75,000 | $198,800 |
| 2016 | $2,260 | $269,400 | $75,000 | $194,400 |
| 2015 | $1,025 | $250,400 | $75,000 | $175,400 |
| 2014 | -- | $248,100 | $75,000 | $173,100 |
Source: Public Records
Map
Nearby Homes
- 103 Lide Place
- 102 Slate Place
- 195 Brookwood Dr
- 129 Old Fifth Cir
- 149 Brookwood Dr
- 118 Roys Place
- 106 Paynes Mill Rd
- 1638 Rialto St
- 1509 6th St SE
- 985 5th St SW
- 2520 Naylor St
- 1450 Avon St
- 103 Longwood Dr Unit E
- 904 Rock Creek Rd
- 120 Longwood Dr Unit A
- 1642 Meridian St
- 802 Orangedale Ave
- 1641 Meridian St
- 2 Flint Dr
- 28 Keene Ct
Your Personal Tour Guide
Ask me questions while you tour the home.