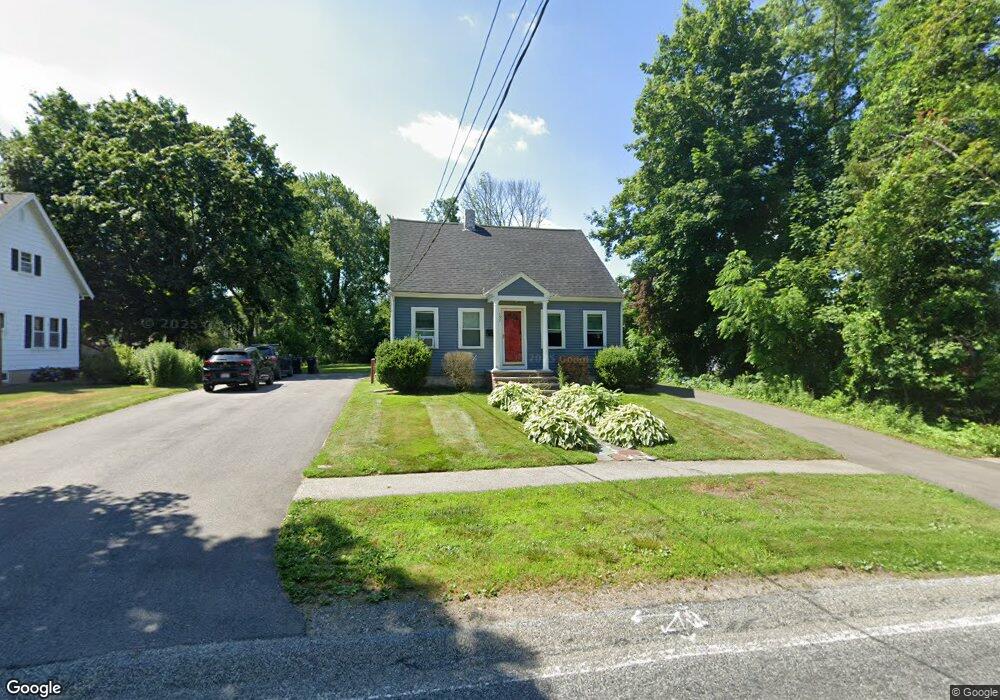
152 W Union St East Bridgewater, MA 02333
Estimated Value: $569,667 - $629,000
4
Beds
2
Baths
2,080
Sq Ft
$290/Sq Ft
Est. Value
About This Home
This home is located at 152 W Union St, East Bridgewater, MA 02333 and is currently estimated at $602,667, approximately $289 per square foot. 152 W Union St is a home located in Plymouth County with nearby schools including Central Elementary School, Gordon W Mitchell Middle School, and East Bridgewater Jr./Sr. High School.
Ownership History
Date
Name
Owned For
Owner Type
Purchase Details
Closed on
Jul 28, 2023
Sold by
Phillips Janice M Est and Phillips
Bought by
Phillips Kerri
Current Estimated Value
Purchase Details
Closed on
May 7, 2019
Sold by
Phillips Kevin M and Scott Lynn M
Bought by
Phillips Kerri M
Purchase Details
Closed on
Oct 26, 2007
Sold by
Degraffenreid Carol S and Rodricks Carol S
Bought by
Phillips Janice
Home Financials for this Owner
Home Financials are based on the most recent Mortgage that was taken out on this home.
Original Mortgage
$237,600
Interest Rate
6.39%
Mortgage Type
Purchase Money Mortgage
Purchase Details
Closed on
Sep 11, 1992
Sold by
Rodricks Rose M and Rodricks Edward L
Bought by
Rodricks Joseph V and Rodricks Carol S
Create a Home Valuation Report for This Property
The Home Valuation Report is an in-depth analysis detailing your home's value as well as a comparison with similar homes in the area
Home Values in the Area
Average Home Value in this Area
Purchase History
| Date | Buyer | Sale Price | Title Company |
|---|---|---|---|
| Phillips Kerri | -- | None Available | |
| Phillips Kerri M | -- | -- | |
| Phillips Kevin M | -- | -- | |
| Phillips Janice | $264,000 | -- | |
| Rodricks Joseph V | $132,250 | -- |
Source: Public Records
Mortgage History
| Date | Status | Borrower | Loan Amount |
|---|---|---|---|
| Previous Owner | Rodricks Joseph V | $237,600 | |
| Previous Owner | Rodricks Joseph V | $100,000 |
Source: Public Records
Tax History Compared to Growth
Tax History
| Year | Tax Paid | Tax Assessment Tax Assessment Total Assessment is a certain percentage of the fair market value that is determined by local assessors to be the total taxable value of land and additions on the property. | Land | Improvement |
|---|---|---|---|---|
| 2025 | $6,701 | $490,200 | $179,700 | $310,500 |
| 2024 | $6,526 | $471,500 | $172,800 | $298,700 |
| 2023 | $6,549 | $453,200 | $172,800 | $280,400 |
| 2022 | $6,196 | $397,200 | $157,200 | $240,000 |
| 2021 | $5,258 | $308,400 | $151,100 | $157,300 |
| 2020 | $5,128 | $296,600 | $145,300 | $151,300 |
| 2019 | $5,019 | $285,800 | $138,800 | $147,000 |
| 2018 | $4,801 | $267,300 | $138,800 | $128,500 |
| 2017 | $4,701 | $256,900 | $132,400 | $124,500 |
| 2016 | $4,622 | $254,500 | $132,400 | $122,100 |
| 2015 | $4,532 | $255,200 | $131,500 | $123,700 |
| 2014 | $4,422 | $254,600 | $128,700 | $125,900 |
Source: Public Records
Map
Nearby Homes