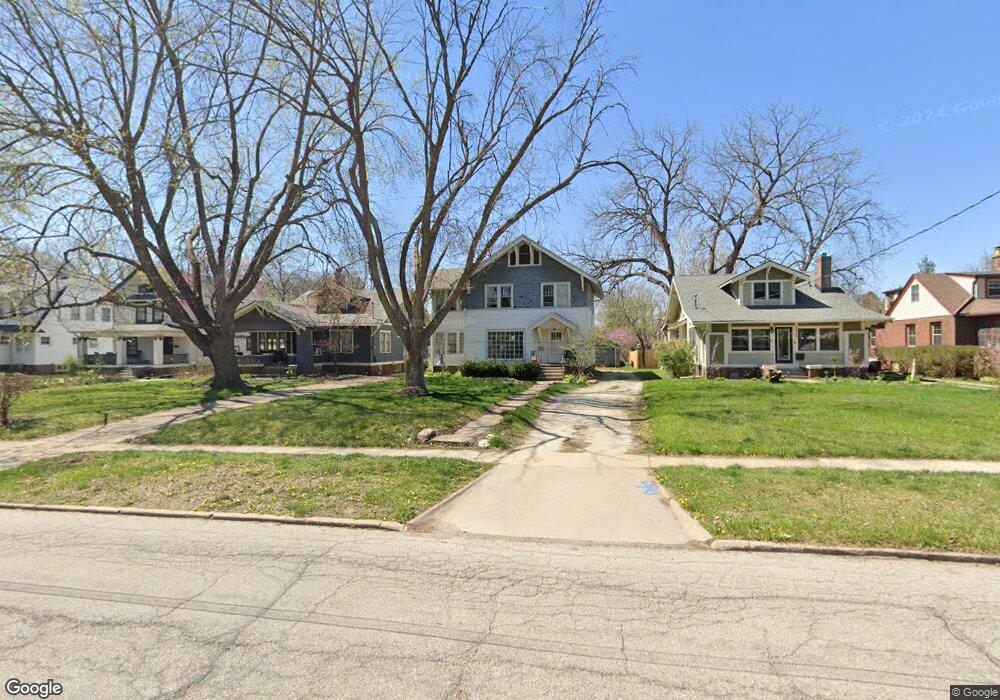
1520 48th St Des Moines, IA 50311
Waveland Park NeighborhoodEstimated Value: $298,000 - $326,000
3
Beds
2
Baths
1,760
Sq Ft
$176/Sq Ft
Est. Value
About This Home
This home is located at 1520 48th St, Des Moines, IA 50311 and is currently estimated at $310,308, approximately $176 per square foot. 1520 48th St is a home located in Polk County with nearby schools including Perkins Elementary School, Merrill Middle School, and Roosevelt High School.
Ownership History
Date
Name
Owned For
Owner Type
Purchase Details
Closed on
Aug 28, 2007
Sold by
Huston David C and Allen Alice M
Bought by
Kennedy Mark and Kennedy Angela
Current Estimated Value
Home Financials for this Owner
Home Financials are based on the most recent Mortgage that was taken out on this home.
Original Mortgage
$14,850
Outstanding Balance
$6,621
Interest Rate
6.63%
Mortgage Type
Credit Line Revolving
Estimated Equity
$303,687
Create a Home Valuation Report for This Property
The Home Valuation Report is an in-depth analysis detailing your home's value as well as a comparison with similar homes in the area
Home Values in the Area
Average Home Value in this Area
Purchase History
| Date | Buyer | Sale Price | Title Company |
|---|---|---|---|
| Kennedy Mark | $150,500 | None Available |
Source: Public Records
Mortgage History
| Date | Status | Borrower | Loan Amount |
|---|---|---|---|
| Open | Kennedy Mark | $14,850 | |
| Open | Kennedy Mark | $118,800 |
Source: Public Records
Tax History Compared to Growth
Tax History
| Year | Tax Paid | Tax Assessment Tax Assessment Total Assessment is a certain percentage of the fair market value that is determined by local assessors to be the total taxable value of land and additions on the property. | Land | Improvement |
|---|---|---|---|---|
| 2025 | $5,408 | $308,300 | $65,900 | $242,400 |
| 2024 | $5,408 | $274,900 | $58,400 | $216,500 |
| 2023 | $5,510 | $274,900 | $58,400 | $216,500 |
| 2022 | $5,468 | $233,800 | $51,600 | $182,200 |
| 2021 | $5,288 | $233,800 | $51,600 | $182,200 |
| 2020 | $5,494 | $211,900 | $47,100 | $164,800 |
| 2019 | $5,056 | $211,900 | $47,100 | $164,800 |
| 2018 | $5,004 | $188,100 | $41,200 | $146,900 |
| 2017 | $4,560 | $188,100 | $41,200 | $146,900 |
| 2016 | $4,442 | $168,600 | $36,900 | $131,700 |
| 2015 | $4,442 | $168,600 | $36,900 | $131,700 |
| 2014 | $3,946 | $148,500 | $32,300 | $116,200 |
Source: Public Records
Map
Nearby Homes