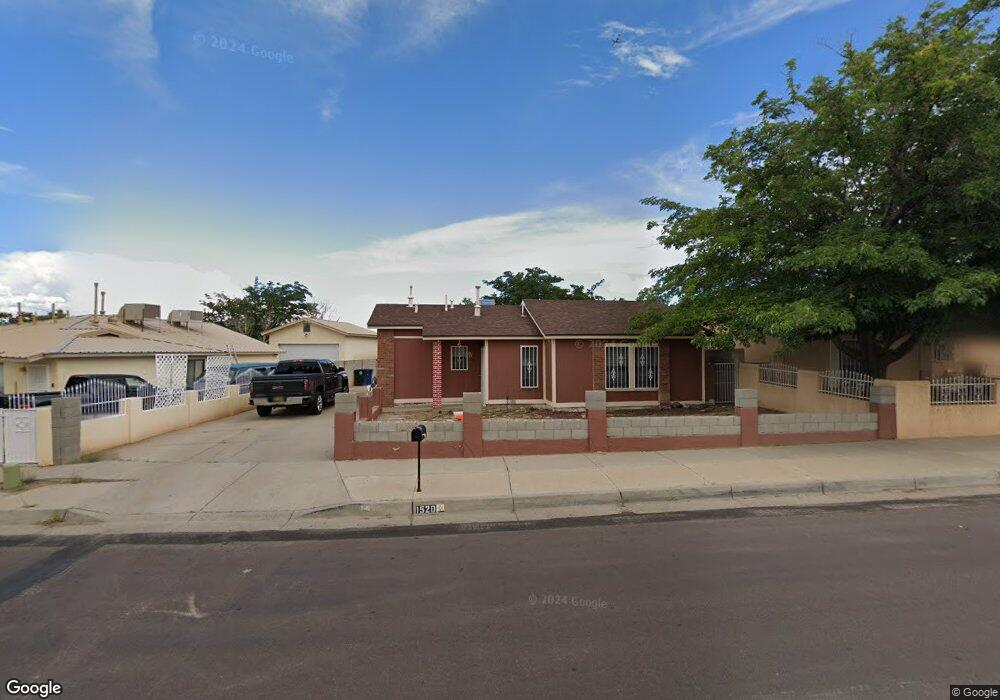
1520 86th St SW Albuquerque, NM 87121
Southwest Heights NeighborhoodEstimated Value: $214,000 - $254,000
2
Beds
1
Bath
984
Sq Ft
$237/Sq Ft
Est. Value
About This Home
This home is located at 1520 86th St SW, Albuquerque, NM 87121 and is currently estimated at $232,749, approximately $236 per square foot. 1520 86th St SW is a home located in Bernalillo County with nearby schools including Maryann Binford Elementary School, Truman Middle School, and Atrisco Heritage Academy High School.
Ownership History
Date
Name
Owned For
Owner Type
Purchase Details
Closed on
Apr 19, 2017
Sold by
Riley Rustin L
Bought by
Garcia J Carlos
Current Estimated Value
Home Financials for this Owner
Home Financials are based on the most recent Mortgage that was taken out on this home.
Original Mortgage
$98,940
Outstanding Balance
$82,137
Interest Rate
4.21%
Mortgage Type
New Conventional
Estimated Equity
$150,612
Purchase Details
Closed on
Nov 23, 2005
Sold by
Cordova Lisa M
Bought by
Riley Rustin L
Home Financials for this Owner
Home Financials are based on the most recent Mortgage that was taken out on this home.
Original Mortgage
$90,160
Interest Rate
6.06%
Mortgage Type
Fannie Mae Freddie Mac
Purchase Details
Closed on
Aug 25, 2005
Sold by
Hud
Bought by
Cordova Lisa M
Purchase Details
Closed on
Feb 18, 2005
Sold by
Charter Bank
Bought by
Hud
Purchase Details
Closed on
Jan 14, 2005
Sold by
Sena Joray T
Bought by
Charter Bank
Purchase Details
Closed on
Feb 15, 2002
Sold by
Sena Connie M
Bought by
Sena Joray T
Create a Home Valuation Report for This Property
The Home Valuation Report is an in-depth analysis detailing your home's value as well as a comparison with similar homes in the area
Home Values in the Area
Average Home Value in this Area
Purchase History
| Date | Buyer | Sale Price | Title Company |
|---|---|---|---|
| Garcia J Carlos | -- | Fidelity Natl Title Ins Co | |
| Riley Rustin L | -- | Fidelity Natl Title Ins Co | |
| Cordova Lisa M | -- | Fidelity National Title Co | |
| Hud | -- | Rgtc | |
| Charter Bank | $68,239 | -- | |
| Sena Joray T | -- | -- |
Source: Public Records
Mortgage History
| Date | Status | Borrower | Loan Amount |
|---|---|---|---|
| Open | Garcia J Carlos | $98,940 | |
| Previous Owner | Riley Rustin L | $90,160 |
Source: Public Records
Tax History Compared to Growth
Tax History
| Year | Tax Paid | Tax Assessment Tax Assessment Total Assessment is a certain percentage of the fair market value that is determined by local assessors to be the total taxable value of land and additions on the property. | Land | Improvement |
|---|---|---|---|---|
| 2025 | $1,494 | $36,478 | $8,152 | $28,326 |
| 2024 | $1,494 | $35,416 | $7,915 | $27,501 |
| 2023 | $1,469 | $34,384 | $7,684 | $26,700 |
| 2022 | $1,420 | $33,383 | $7,461 | $25,922 |
| 2021 | $1,372 | $32,411 | $7,244 | $25,167 |
| 2020 | $1,390 | $32,411 | $7,244 | $25,167 |
| 2019 | $1,390 | $32,411 | $7,244 | $25,167 |
| 2018 | $1,340 | $32,411 | $7,244 | $25,167 |
| 2017 | $1,012 | $31,467 | $7,033 | $24,434 |
| 2016 | $983 | $23,104 | $7,244 | $15,860 |
| 2015 | $22,431 | $22,431 | $7,033 | $15,398 |
| 2014 | $953 | $22,431 | $7,033 | $15,398 |
| 2013 | -- | $22,598 | $7,033 | $15,565 |
Source: Public Records
Map
Nearby Homes
- 1209 Locura Rd SW
- 8600 Kimela Ct SW
- 9300 Jenny Ave SW
- 9508 Sage Ranch Ct SW
- 9520 Sage Ranch Ct SW
- 9504 Sage Ranch Ct
- 9600 Sage Ranch Ct
- 9616 Sage Ranch Ct SW
- 1327 Amole Vista St SW
- 9609 Sage Ranch Ct SW
- 9620 Sage Ranch Ct
- 8709 Rhonda Ave SW
- 1420 Summerfield Place SW
- 0 Sage & 90th St SW Unit 1083191
- 7901 Purple Fringe Rd SW
- 9909 Saddlehorn Trail SW
- 1815 Shadetree Dr SW
- 921 Roma Dora Ln
- 7814 Desert Canyon Place SW
- 8524 Stony Creek Rd SW
- 1524 86th St SW
- 1516 86th St SW
- 1528 86th St SW
- 1512 86th St SW
- 1523 86th St SW
- 8924 Alexis Ct SW
- 8920 Alexis Ct SW
- 1519 86th St SW
- 1515 86th St SW
- 1508 86th St SW
- 8928 Alexis Ct SW
- 1527 86th St SW
- 8916 Alexis Ct SW
- 1508 Camino San Martin Ct SW
- 1507 86th St SW
- 1504 Camino San Martin Ct SW
- 1504 86th St SW
- 9106 Mindy Ln SW
- 9112 Camino San Martin SW
- 9108 Camino San Martin SW