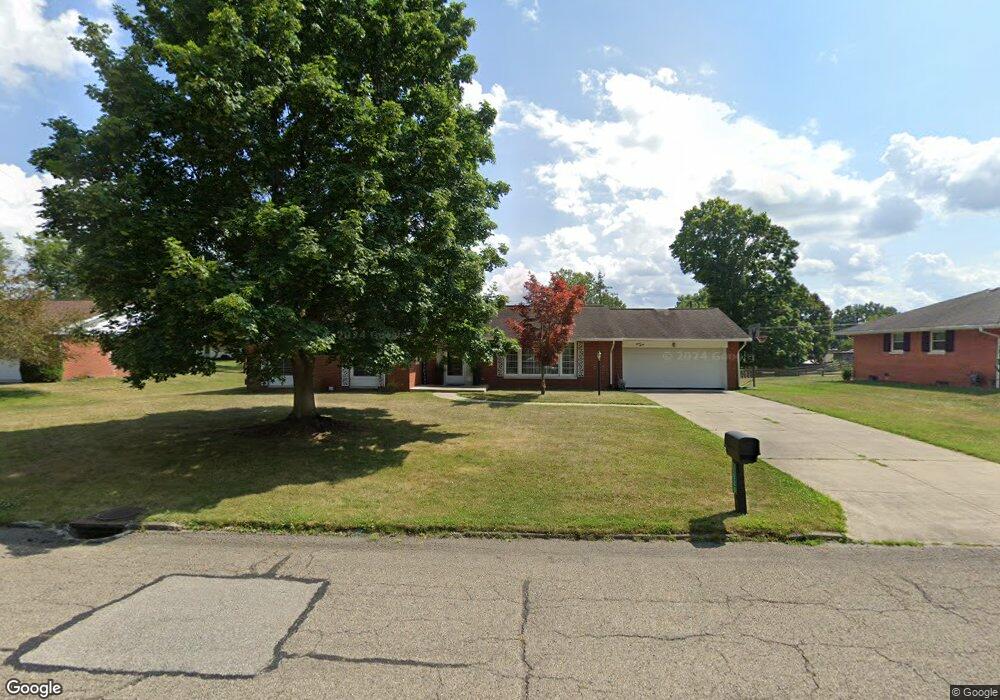
1520 Concordia Dr Lancaster, OH 43130
Estimated Value: $283,797 - $314,000
3
Beds
2
Baths
1,545
Sq Ft
$194/Sq Ft
Est. Value
About This Home
This home is located at 1520 Concordia Dr, Lancaster, OH 43130 and is currently estimated at $299,199, approximately $193 per square foot. 1520 Concordia Dr is a home located in Fairfield County with nearby schools including Medill Elementary School, Thomas Ewing Junior High School, and Lancaster High School.
Ownership History
Date
Name
Owned For
Owner Type
Purchase Details
Closed on
Jul 31, 2015
Sold by
Spaun Thelma J
Bought by
Hinkle Patricia A
Current Estimated Value
Home Financials for this Owner
Home Financials are based on the most recent Mortgage that was taken out on this home.
Original Mortgage
$120,000
Interest Rate
4.08%
Mortgage Type
New Conventional
Purchase Details
Closed on
Aug 29, 2007
Sold by
Spaun Earl R and Spaun Thelma J
Bought by
Spaun Earl R and Spaun Thelma J
Purchase Details
Closed on
Sep 20, 2004
Sold by
Delong Betty J
Bought by
Spaun Earl R and Spaun Thelma J
Purchase Details
Closed on
Dec 19, 1994
Sold by
England Dean F
Bought by
Delong Wallace C and Delong Betty J
Purchase Details
Closed on
Aug 27, 1993
Sold by
Mogil Henrietta A
Bought by
England Dean F
Create a Home Valuation Report for This Property
The Home Valuation Report is an in-depth analysis detailing your home's value as well as a comparison with similar homes in the area
Home Values in the Area
Average Home Value in this Area
Purchase History
| Date | Buyer | Sale Price | Title Company |
|---|---|---|---|
| Hinkle Patricia A | $150,000 | Valmer Land Title Agency Box | |
| Spaun Earl R | -- | Attorney | |
| Spaun Earl R | $175,000 | Lawyers Title Agency Of Lanc | |
| Delong Wallace C | $162,000 | -- | |
| England Dean F | $130,000 | -- |
Source: Public Records
Mortgage History
| Date | Status | Borrower | Loan Amount |
|---|---|---|---|
| Previous Owner | Hinkle Patricia A | $120,000 |
Source: Public Records
Tax History Compared to Growth
Tax History
| Year | Tax Paid | Tax Assessment Tax Assessment Total Assessment is a certain percentage of the fair market value that is determined by local assessors to be the total taxable value of land and additions on the property. | Land | Improvement |
|---|---|---|---|---|
| 2024 | $6,460 | $71,860 | $12,230 | $59,630 |
| 2023 | $2,575 | $70,810 | $12,230 | $58,580 |
| 2022 | $2,586 | $70,810 | $12,230 | $58,580 |
| 2021 | $2,380 | $61,050 | $12,230 | $48,820 |
| 2020 | $2,280 | $61,050 | $12,230 | $48,820 |
| 2019 | $2,168 | $61,050 | $12,230 | $48,820 |
| 2018 | $2,019 | $49,440 | $12,230 | $37,210 |
| 2017 | $2,020 | $54,000 | $12,230 | $41,770 |
| 2016 | $1,967 | $54,000 | $12,230 | $41,770 |
| 2015 | $1,707 | $54,230 | $12,230 | $42,000 |
| 2014 | $1,626 | $54,230 | $12,230 | $42,000 |
| 2013 | $1,626 | $54,230 | $12,230 | $42,000 |
Source: Public Records
Map
Nearby Homes
- 1660 Lynn Dr
- 1264 Stonehill Ln Unit 1264
- 1246 Stoneridge Place
- 1522 Pleasantview Dr
- 1415 Epworth Forest Dr
- 1331 Marietta Rd
- 435 Sells Rd
- 1066 Lanreco Blvd
- 105 Dogwood Ln
- 1271 Huffer Ave
- 1275 Wetsell Ave
- 1080 Sycamore Dr
- 1020 Sycamore Dr
- 146 Hickory Ln
- 1804 Pleasantville Rd
- 2580 Applewood Ln NE
- 1150 E Fair Ave
- 134 Kanawha Rd
- 534 Overlook Dr NE
- 608 Sheridan Dr
- 1510 Concordia Dr
- 1530 Concordia Dr
- 1652 Pleasantview Dr
- 1529 Concordia Dr
- 1502 Concordia Dr
- 1681 Lynn Dr
- 1612 Pleasantview Dr
- 1540 Concordia Dr
- 1675 Lynn Dr
- 1662 Pleasantview Dr
- 1541 Concordia Dr
- 1667 Lynn Dr
- LOT 9 Pleasantview Dr
- LOT 12 Pleasantview Dr
- LOT 10 Pleasantview Dr
- LOT 8 Pleasantview Dr
- LOT 6 Pleasantview Dr
- LOT 11 Pleasantview Dr
- LOT 7 Pleasantview Dr
- O Pleasantview Dr