1520 E 56th St Brooklyn, NY 11234
Flatlands NeighborhoodEstimated Value: $137,264 - $720,000
--
Bed
--
Bath
352
Sq Ft
$1,011/Sq Ft
Est. Value
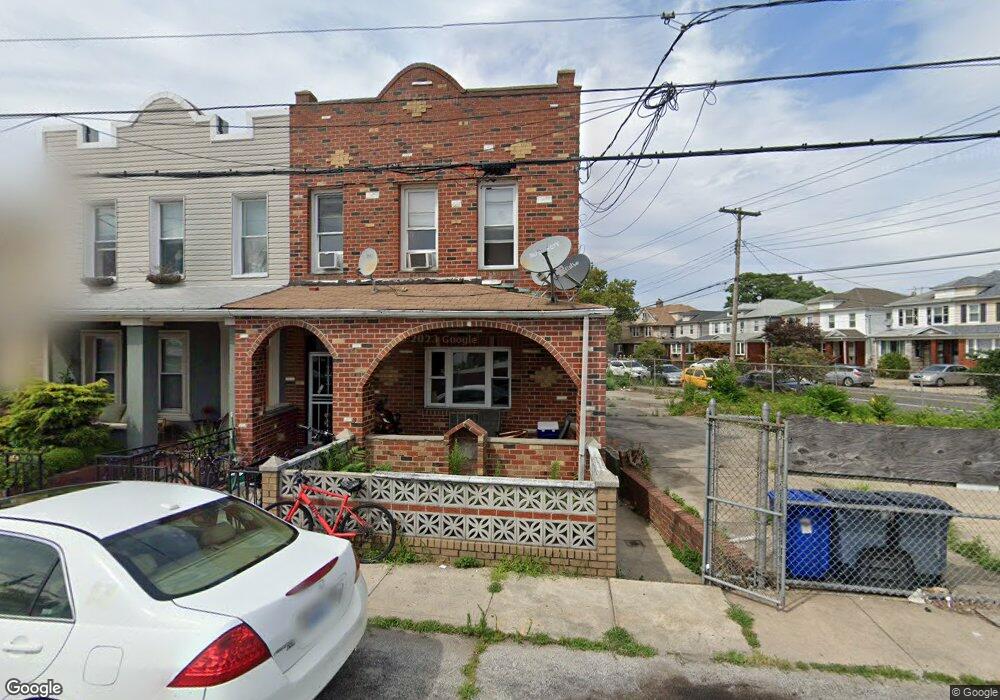
About This Home
This home is located at 1520 E 56th St, Brooklyn, NY 11234 and is currently estimated at $355,755, approximately $1,010 per square foot. 1520 E 56th St is a home located in Kings County with nearby schools including P.S. 203 Floyd Bennett, Success Academy Charter School - Bergen Beach, and Hebrew Language Academy.
Ownership History
Date
Name
Owned For
Owner Type
Purchase Details
Closed on
Dec 27, 2007
Sold by
Norstar Development Llc
Bought by
Lubin Housing Llc
Current Estimated Value
Purchase Details
Closed on
Dec 22, 2006
Sold by
Lubin Housing Llc
Bought by
Norstar Development Llc
Purchase Details
Closed on
Aug 11, 2004
Sold by
Dimaiuta Frank and Dimaiuta John
Bought by
Dimaiuta Frank and Dimaiuta John
Create a Home Valuation Report for This Property
The Home Valuation Report is an in-depth analysis detailing your home's value as well as a comparison with similar homes in the area
Home Values in the Area
Average Home Value in this Area
Purchase History
| Date | Buyer | Sale Price | Title Company |
|---|---|---|---|
| Lubin Housing Llc | $75,000 | -- | |
| Lubin Housing Llc | $75,000 | -- | |
| Norstar Development Llc | $75,000 | -- | |
| Norstar Development Llc | $75,000 | -- | |
| Dimaiuta Frank | -- | -- | |
| Dimaiuta Frank | -- | -- |
Source: Public Records
Tax History Compared to Growth
Tax History
| Year | Tax Paid | Tax Assessment Tax Assessment Total Assessment is a certain percentage of the fair market value that is determined by local assessors to be the total taxable value of land and additions on the property. | Land | Improvement |
|---|---|---|---|---|
| 2025 | $2,628 | $13,500 | $13,500 | -- |
| 2024 | $2,628 | $13,320 | $13,320 | $0 |
| 2023 | $2,507 | $14,040 | $14,040 | $0 |
| 2022 | $2,464 | $14,760 | $14,760 | $0 |
| 2021 | $2,578 | $15,360 | $15,360 | $0 |
| 2020 | $2,432 | $13,860 | $13,860 | $0 |
| 2019 | $2,281 | $12,060 | $12,060 | $0 |
| 2018 | $2,097 | $10,285 | $10,285 | $0 |
| 2017 | $2,097 | $10,285 | $10,285 | $0 |
| 2016 | $2,040 | $10,207 | $10,207 | $0 |
| 2015 | $1,170 | $9,630 | $9,630 | $0 |
| 2014 | $1,170 | $9,085 | $9,085 | $0 |
Source: Public Records
Map
Nearby Homes