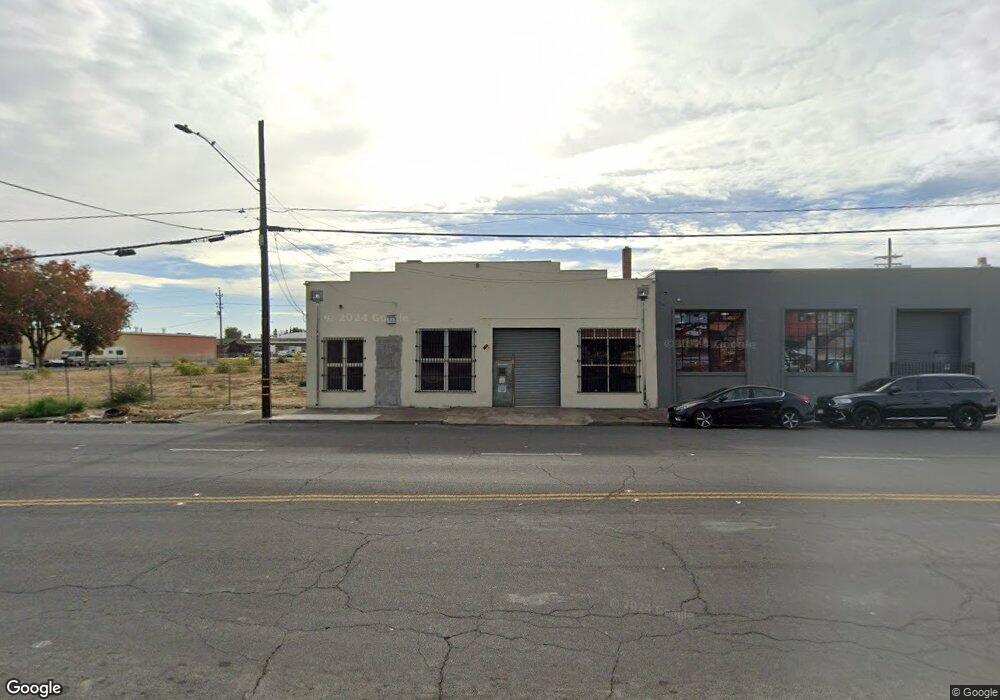
1520 E Miner Ave Stockton, CA 95205
Downtown Stockton NeighborhoodEstimated Value: $405,826
Studio
--
Bath
10,085
Sq Ft
$40/Sq Ft
Est. Value
About This Home
This home is located at 1520 E Miner Ave, Stockton, CA 95205 and is currently estimated at $405,826, approximately $40 per square foot. 1520 E Miner Ave is a home located in San Joaquin County with nearby schools including John C. Fremont Elementary School, Fillmore Elementary School, and King Elementary School.
Ownership History
Date
Name
Owned For
Owner Type
Purchase Details
Closed on
Aug 2, 2024
Sold by
Q And J Property Management Llc
Bought by
Pal Properties Llc
Current Estimated Value
Purchase Details
Closed on
Jun 23, 2020
Sold by
Wu Sikaeu Ngau and Lam Jimmy Luong
Bought by
Q & J Property Management Llc
Home Financials for this Owner
Home Financials are based on the most recent Mortgage that was taken out on this home.
Original Mortgage
$280,000
Interest Rate
3.5%
Mortgage Type
Balloon
Purchase Details
Closed on
May 7, 2020
Sold by
Kong Siv Keav
Bought by
Wu Sikaeu Ngau
Home Financials for this Owner
Home Financials are based on the most recent Mortgage that was taken out on this home.
Original Mortgage
$280,000
Interest Rate
3.5%
Mortgage Type
Balloon
Purchase Details
Closed on
Nov 29, 2006
Sold by
Oneto John W
Bought by
Oneto John W and Oneto Reta Nell
Create a Home Valuation Report for This Property
The Home Valuation Report is an in-depth analysis detailing your home's value as well as a comparison with similar homes in the area
Home Values in the Area
Average Home Value in this Area
Purchase History
| Date | Buyer | Sale Price | Title Company |
|---|---|---|---|
| Pal Properties Llc | $400,000 | Old Republic Title | |
| Q & J Property Management Llc | -- | None Available | |
| Wu Sikaeu Ngau | -- | Calatlantic Title Inc | |
| Wu Sikaeu Ngau | $400,000 | Calatlantic Title Inc | |
| Oneto John W | -- | None Available |
Source: Public Records
Mortgage History
| Date | Status | Borrower | Loan Amount |
|---|---|---|---|
| Previous Owner | Wu Sikaeu Ngau | $280,000 |
Source: Public Records
Tax History
| Year | Tax Paid | Tax Assessment Tax Assessment Total Assessment is a certain percentage of the fair market value that is determined by local assessors to be the total taxable value of land and additions on the property. | Land | Improvement |
|---|---|---|---|---|
| 2025 | $4,974 | $400,000 | $150,000 | $250,000 |
| 2024 | $5,343 | $428,877 | $80,413 | $348,464 |
| 2023 | $5,223 | $420,469 | $78,837 | $341,632 |
| 2022 | $5,148 | $412,226 | $77,292 | $334,934 |
| 2021 | $4,946 | $404,144 | $75,777 | $328,367 |
| 2020 | $2,669 | $209,523 | $67,243 | $142,280 |
| 2019 | $2,659 | $205,416 | $65,925 | $139,491 |
| 2018 | $2,609 | $201,389 | $64,633 | $136,756 |
| 2017 | $2,472 | $197,441 | $63,366 | $134,075 |
| 2016 | $2,517 | $193,570 | $62,124 | $131,446 |
| 2014 | $2,394 | $186,930 | $59,993 | $126,937 |
Source: Public Records
Map
Nearby Homes
- 1200 E Miner Ave
- 29 S Sierra Nevada St
- 1211 E Main St
- 2018 E Myrtle St
- 1123 E Park St
- 1224 E Lafayette St
- 336 S Airport Way
- 1806 E Poplar St
- 1245 E Poplar St
- 345 S Pilgrim St
- 2006 E Lafayette St
- 630 N Watts Ave
- 2117 E Washington St
- 727 E Lindsay St
- 1865 E Acacia St
- 1237 E Hazelton Ave
- 0 Park Unit SR25247647
- 1926 E Roosevelt St
- 2311 E Oak St
- 2111 E Hazelton Ave
- 1510 E Miner Ave
- 1540 E Miner Ave
- 1 E Off Center
- 0 1850 Country Club Unit 11037486
- 1527 E Channel St
- 221 Eugenia Ave
- 235 Eugenia Ave
- 225 Eugenia Ave
- 1533 E Channel St
- 1545 E Channel St
- 1545 Channel St
- 1604 E Miner Ave
- 322 N Wilson Way
- 1624 E Miner Ave
- 1630 E Miner Ave
- 340 N Wilson Way
- 1414 E Miner Ave
- 1627 E Channel St
- 1640 E Miner Ave
- 1409 E Channel St
Your Personal Tour Guide
Ask me questions while you tour the home.