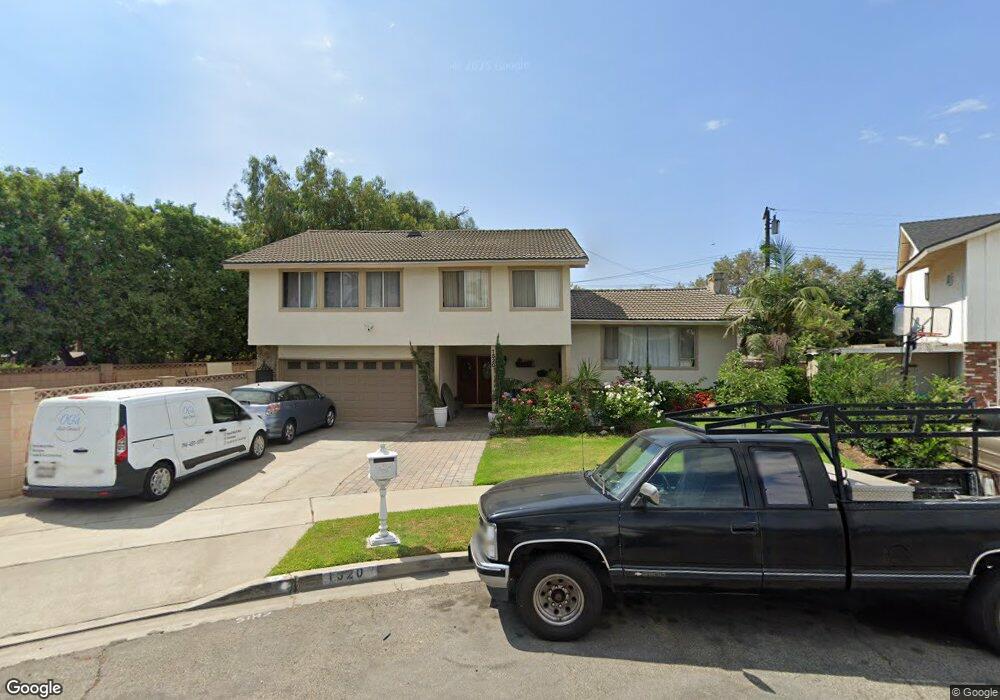
1520 E Nubian Ln Orange, CA 92866
Estimated Value: $1,207,000 - $1,305,000
4
Beds
3
Baths
2,610
Sq Ft
$479/Sq Ft
Est. Value
About This Home
This home is located at 1520 E Nubian Ln, Orange, CA 92866 and is currently estimated at $1,250,358, approximately $479 per square foot. 1520 E Nubian Ln is a home located in Orange County with nearby schools including Fairhaven Elementary School, Portola Middle School, and Orange High School.
Ownership History
Date
Name
Owned For
Owner Type
Purchase Details
Closed on
Feb 10, 2019
Sold by
Castro Anacleto
Bought by
Castro Anacleto and Gonzalez Mariana Castro
Current Estimated Value
Purchase Details
Closed on
Feb 7, 1996
Sold by
Taylor Darrell G and Taylor Carolyn S
Bought by
Castro Anacleto and Castro Suzanna
Home Financials for this Owner
Home Financials are based on the most recent Mortgage that was taken out on this home.
Original Mortgage
$160,300
Interest Rate
6.98%
Purchase Details
Closed on
Feb 24, 1994
Sold by
Taylor Darrell G and Taylor Carolyn S
Bought by
Taylor Darrell G and Taylor Carolyn S
Purchase Details
Closed on
Oct 7, 1993
Sold by
Taylor Darrell G and Taylor Carolyn S
Bought by
Taylor Darrell G and Taylor Carolyn S
Home Financials for this Owner
Home Financials are based on the most recent Mortgage that was taken out on this home.
Original Mortgage
$44,150
Interest Rate
7.1%
Create a Home Valuation Report for This Property
The Home Valuation Report is an in-depth analysis detailing your home's value as well as a comparison with similar homes in the area
Home Values in the Area
Average Home Value in this Area
Purchase History
| Date | Buyer | Sale Price | Title Company |
|---|---|---|---|
| Castro Anacleto | -- | None Available | |
| Castro Anacleto | $229,000 | Landwood Title Company | |
| Taylor Darrell G | -- | -- | |
| Taylor Darrell G | -- | United Title Company |
Source: Public Records
Mortgage History
| Date | Status | Borrower | Loan Amount |
|---|---|---|---|
| Previous Owner | Castro Anacleto | $160,300 | |
| Previous Owner | Taylor Darrell G | $44,150 |
Source: Public Records
Tax History
| Year | Tax Paid | Tax Assessment Tax Assessment Total Assessment is a certain percentage of the fair market value that is determined by local assessors to be the total taxable value of land and additions on the property. | Land | Improvement |
|---|---|---|---|---|
| 2025 | $4,514 | $380,417 | $210,680 | $169,737 |
| 2024 | $4,514 | $372,958 | $206,549 | $166,409 |
| 2023 | $4,405 | $365,646 | $202,499 | $163,147 |
| 2022 | $4,312 | $358,477 | $198,528 | $159,949 |
| 2021 | $4,198 | $351,449 | $194,636 | $156,813 |
| 2020 | $4,157 | $347,846 | $192,640 | $155,206 |
| 2019 | $4,104 | $341,026 | $188,863 | $152,163 |
| 2018 | $4,041 | $334,340 | $185,160 | $149,180 |
| 2017 | $3,874 | $327,785 | $181,530 | $146,255 |
| 2016 | $3,778 | $321,358 | $177,970 | $143,388 |
| 2015 | $3,724 | $316,531 | $175,296 | $141,235 |
| 2014 | $3,647 | $310,331 | $171,862 | $138,469 |
Source: Public Records
Map
Nearby Homes
- 2624 N Tustin Ave Unit D (141)
- 2604 N Tustin Ave Unit C
- 2516 N Tustin Ave Unit A
- 2512 N Tustin Ave Unit D
- 2514 N Tustin Ave Unit 66
- 2610 Deodar St
- 1201 E Fairway Dr
- 2232 Joana Dr
- 2517 Deodar St
- 762 S Breezy Way
- 2318 Franzen Ave
- 2544 Park Lake
- 2528 Park Lake Unit 108
- 2030 E Santa Clara Ave Unit K2
- 2509 Park Lake Unit 182
- 2508 Park Lake
- 2726 Concord St
- 13252 Marshall Ln
- 1609 E Canyon Lake Ave Unit 137
- 2624 Forest Lake Unit 13
- 1506 E Nubian Ln
- 1521 E Fairhaven Ave
- 1511 E Fairhaven Ave
- 866 S Woodbury Dr
- 1519 E Nubian Ln
- 880 S Woodbury Dr
- 1448 E Nubian Ln
- 1505 E Nubian Ln
- 850 S Woodbury Dr
- 896 S Woodbury Dr
- 1501 E Fairhaven Ave
- 1443 E Nubian Ln
- 1432 E Nubian Ln
- 1518 E Albion Ln
- 1504 E Albion Ln
- 834 S Woodbury Dr
- 891 S Greengrove St
- 1431 E Nubian Ln
- 1442 E Albion Ln
- 820 S Woodbury Dr
Your Personal Tour Guide
Ask me questions while you tour the home.