Estimated Value: $482,000 - $552,000
4
Beds
3
Baths
1,700
Sq Ft
$304/Sq Ft
Est. Value
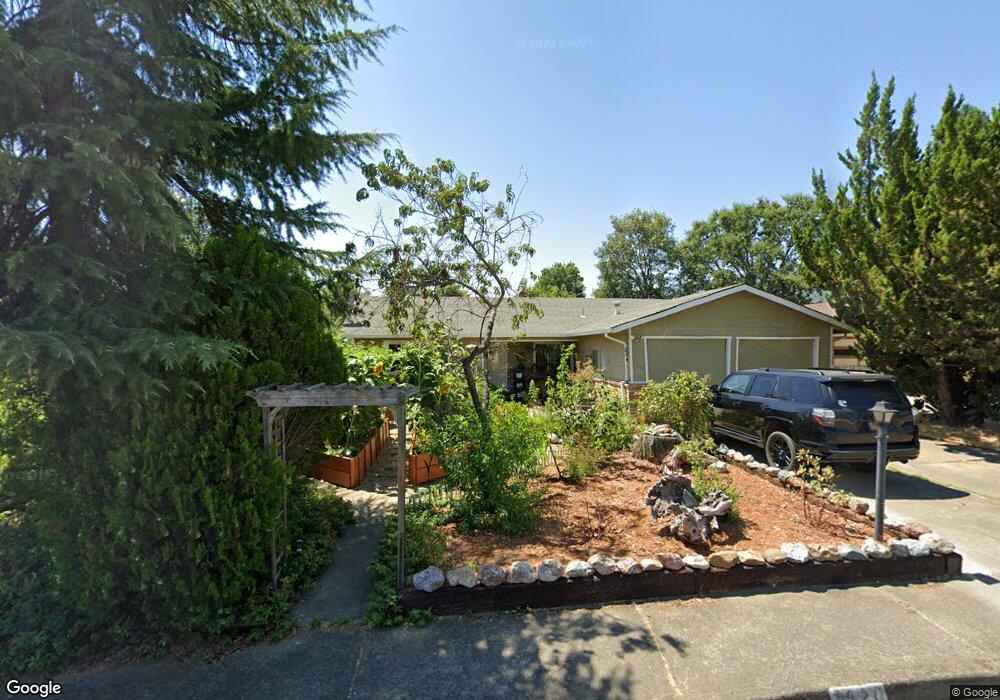
About This Home
This home is located at 1520 Gamay Place, Ukiah, CA 95482 and is currently estimated at $517,574, approximately $304 per square foot. 1520 Gamay Place is a home located in Mendocino County with nearby schools including Frank Zeek Elementary School, Pomolita Middle School, and Ukiah High School.
Ownership History
Date
Name
Owned For
Owner Type
Purchase Details
Closed on
Jun 13, 2001
Sold by
Wong Raymond
Bought by
Wong Connie
Current Estimated Value
Home Financials for this Owner
Home Financials are based on the most recent Mortgage that was taken out on this home.
Original Mortgage
$172,800
Interest Rate
6.63%
Mortgage Type
Purchase Money Mortgage
Purchase Details
Closed on
Nov 20, 1999
Sold by
Wong Connie
Bought by
Wong Raymond and Wong Connie
Home Financials for this Owner
Home Financials are based on the most recent Mortgage that was taken out on this home.
Original Mortgage
$27,000
Interest Rate
7.83%
Mortgage Type
Stand Alone Second
Purchase Details
Closed on
Jun 22, 1999
Sold by
Wong Raymond
Bought by
Wong Connie
Home Financials for this Owner
Home Financials are based on the most recent Mortgage that was taken out on this home.
Original Mortgage
$143,100
Interest Rate
7.05%
Mortgage Type
Purchase Money Mortgage
Create a Home Valuation Report for This Property
The Home Valuation Report is an in-depth analysis detailing your home's value as well as a comparison with similar homes in the area
Purchase History
| Date | Buyer | Sale Price | Title Company |
|---|---|---|---|
| Wong Connie | -- | Fidelity National Title Co | |
| Wong Raymond | -- | Transcontinental Title Co | |
| Wong Connie | -- | First American Title Co | |
| Wong Connie | $159,000 | First American Title Co |
Source: Public Records
Mortgage History
| Date | Status | Borrower | Loan Amount |
|---|---|---|---|
| Closed | Wong Connie | $172,800 | |
| Previous Owner | Wong Raymond | $27,000 | |
| Previous Owner | Wong Connie | $143,100 |
Source: Public Records
Tax History
| Year | Tax Paid | Tax Assessment Tax Assessment Total Assessment is a certain percentage of the fair market value that is determined by local assessors to be the total taxable value of land and additions on the property. | Land | Improvement |
|---|---|---|---|---|
| 2025 | $2,936 | $249,240 | $94,049 | $155,191 |
| 2023 | $2,936 | $239,564 | $90,398 | $149,166 |
| 2022 | $2,811 | $234,868 | $88,626 | $146,242 |
| 2021 | $2,824 | $230,264 | $86,889 | $143,375 |
| 2020 | $2,784 | $227,874 | $85,990 | $141,884 |
| 2019 | $2,632 | $223,406 | $84,304 | $139,102 |
| 2018 | $2,569 | $219,025 | $82,651 | $136,374 |
| 2017 | $2,528 | $214,731 | $81,031 | $133,700 |
| 2016 | $2,454 | $210,521 | $79,442 | $131,079 |
| 2015 | $2,434 | $207,360 | $78,249 | $129,111 |
| 2014 | $2,379 | $203,299 | $76,717 | $126,582 |
Source: Public Records
Map
Nearby Homes
- 1250 Incline Ct
- 1778 Lockwood Dr
- 1724 Lockwood Dr
- 1171 N Bush St
- 744 N State St
- 0 Masonite Rd
- 0 Ford Rd
- 1 Ford Rd
- 640 Dora Ave
- 2475 N North State St Unit 34
- 585 Kunzler Ranch Rd
- 674 Willow Ave
- 0 N School St Unit 325003830
- 1059 W Standley St
- 204 S Dora St
- 1105 W Church St
- 530 W Stephenson St
- 416 Oak Park Ave
- 329 Jones St
- 605 Jones St
- 1530 Gamay Place
- 460 Chablis Dr
- 1450 Gamay Place
- 470 Chablis Dr
- 1540 Gamay Place
- 1531 Gamay Place
- 1521 Gamay Place
- 480 Chablis Dr
- 1550 Gamay Place
- 1541 Gamay Place
- 1511 Gamay Place
- 1471 Gamay Place
- 1461 Gamay Place
- 490 Chablis Dr
- 1551 Gamay Place
- 1481 Gamay Place
- 430 Chablis Dr
- 1501 Gamay Place
- 461 Chablis Dr
- 1380 Sirah Ct
Your Personal Tour Guide
Ask me questions while you tour the home.