1520 Lake St Unit Washington Blvd. and Crescent City, CA 95531
Estimated Value: $319,576 - $471,000
3
Beds
2
Baths
1,620
Sq Ft
$248/Sq Ft
Est. Value
About This Home
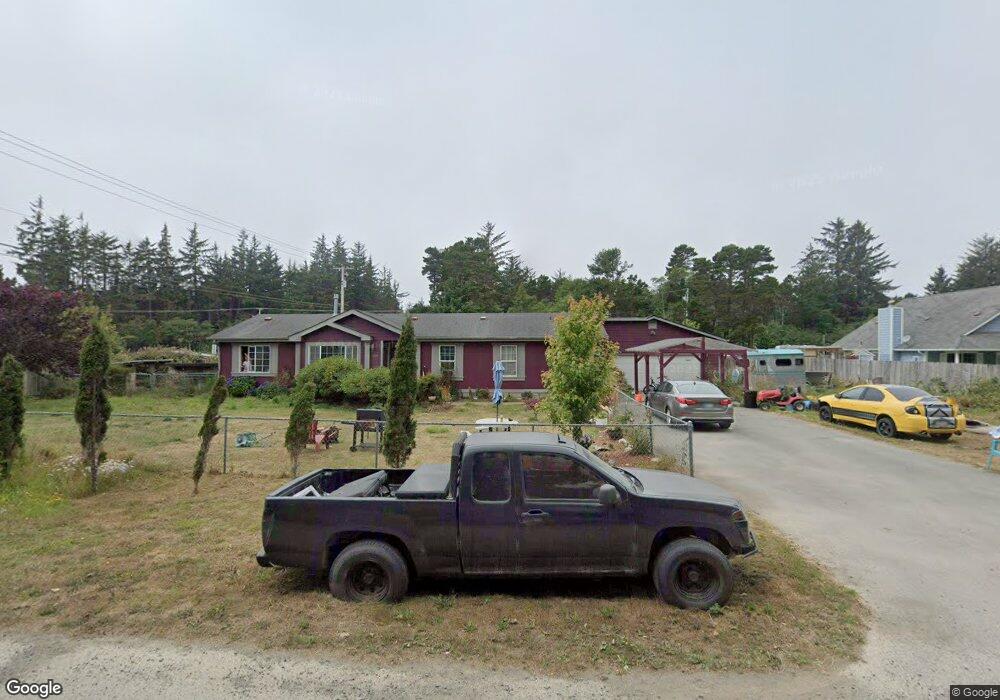
This home is located at 1520 Lake St Unit Washington Blvd. and, Crescent City, CA 95531 and is currently estimated at $401,894, approximately $248 per square foot. 1520 Lake St Unit Washington Blvd. and is a home located in Del Norte County with nearby schools including Mary Peacock Elementary School, Crescent Elk Middle School, and Del Norte High School.
Ownership History
Date
Name
Owned For
Owner Type
Purchase Details
Closed on
Sep 19, 2011
Sold by
Dill David Allen and Dill Jennifer Gabrielle
Bought by
Yurok Indian Housing Authority
Current Estimated Value
Home Financials for this Owner
Home Financials are based on the most recent Mortgage that was taken out on this home.
Original Mortgage
$157,964
Outstanding Balance
$107,779
Interest Rate
4.26%
Mortgage Type
New Conventional
Estimated Equity
$294,115
Purchase Details
Closed on
Feb 3, 2004
Sold by
Lopez R Blaine and Fugate Kevin
Bought by
Dill David Allen and Dill Jennifer Gabrielle
Home Financials for this Owner
Home Financials are based on the most recent Mortgage that was taken out on this home.
Original Mortgage
$156,600
Interest Rate
5.8%
Mortgage Type
Purchase Money Mortgage
Create a Home Valuation Report for This Property
The Home Valuation Report is an in-depth analysis detailing your home's value as well as a comparison with similar homes in the area
Home Values in the Area
Average Home Value in this Area
Purchase History
| Date | Buyer | Sale Price | Title Company |
|---|---|---|---|
| Yurok Indian Housing Authority | $160,000 | Crescent Land Title Company | |
| Dill David Allen | $174,000 | Crescent Land Title |
Source: Public Records
Mortgage History
| Date | Status | Borrower | Loan Amount |
|---|---|---|---|
| Open | Yurok Indian Housing Authority | $157,964 | |
| Previous Owner | Dill David Allen | $156,600 |
Source: Public Records
Tax History Compared to Growth
Tax History
| Year | Tax Paid | Tax Assessment Tax Assessment Total Assessment is a certain percentage of the fair market value that is determined by local assessors to be the total taxable value of land and additions on the property. | Land | Improvement |
|---|---|---|---|---|
| 2025 | $1,887 | $174,577 | $50,235 | $124,342 |
| 2024 | $1,887 | $171,154 | $49,250 | $121,904 |
| 2023 | $1,849 | $167,799 | $48,285 | $119,514 |
| 2022 | $1,812 | $164,510 | $47,339 | $117,171 |
| 2021 | $1,801 | $161,285 | $46,411 | $114,874 |
| 2020 | $1,734 | $159,633 | $45,936 | $113,697 |
| 2019 | $1,706 | $156,504 | $45,036 | $111,468 |
| 2018 | $1,671 | $153,436 | $44,153 | $109,283 |
| 2017 | $1,645 | $150,429 | $43,288 | $107,141 |
| 2016 | $1,616 | $147,481 | $42,440 | $105,041 |
| 2015 | $1,580 | $145,267 | $41,803 | $103,464 |
| 2014 | $1,565 | $142,423 | $40,985 | $101,438 |
Source: Public Records
Map
Nearby Homes
- 000 Isabella
- 1775 Beech St
- APN 110-067-004 Beech St
- 00 Adams Ave
- 941 Hamilton Ave
- 1232 Mcnamara Ave
- 1745 Potomac Ct
- 930 Mcnamara Ave
- 125 W Washington Blvd
- 1840 Keller Ave
- 1760 Amador St
- 120 W Coolidge Ave
- 115 Georgetown Place
- 545 Reddy Ave
- 275 Chevy Chase Way
- 1285 Murphy Ave
- 145 Mason Ct
- 188 E Madison Ave
- 227 Ruchong Ln
- 0 E Adams Ave
- 1340 W Washington Blvd
- 1525 Lake St
- 1535 Lake St Unit Off Washington Blvd
- 1535 Lake St
- 1385 W Washington Blvd
- 1855 Lake St
- 1850 Lake St
- 1565 Lake St Unit Off Washington
- 1565 Lake St
- 1340 Beech St
- 1211 W Washington Blvd
- 1230 Beech St
- 1540 Napa St
- 1520 Napa St
- 1210 Beech St
- 1580 Napa St
- 1300 W Adams Ave
- 1625 Napa St
- 1350 W Adams Ave
- 1250 W Adams Ave