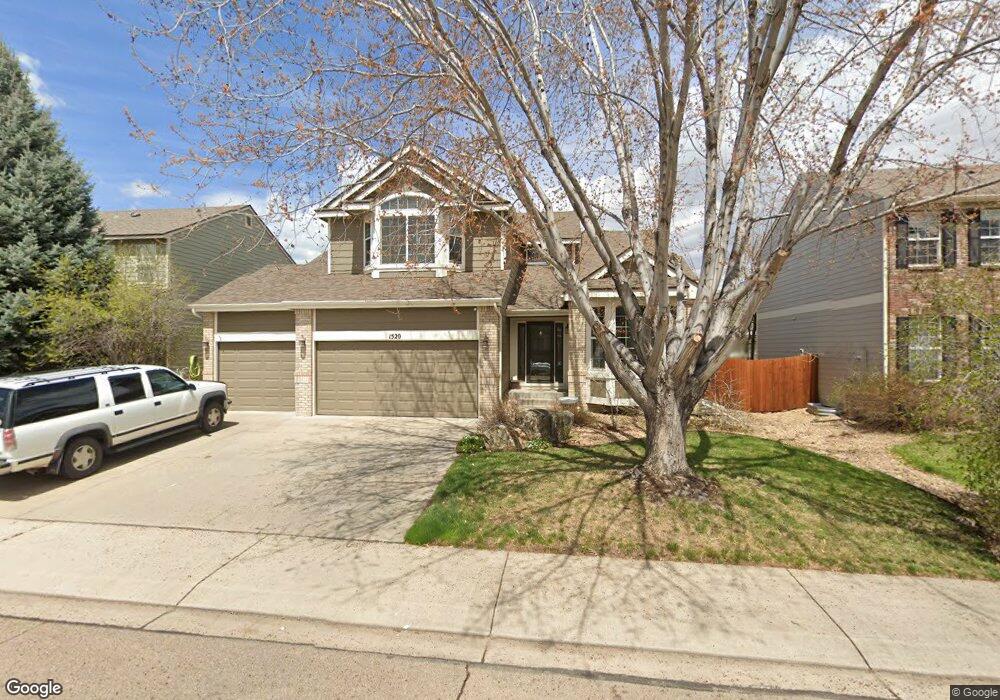
1520 Lark Bunting Place Longmont, CO 80504
East Side NeighborhoodEstimated Value: $721,000 - $814,000
4
Beds
4
Baths
4,459
Sq Ft
$169/Sq Ft
Est. Value
About This Home
This home is located at 1520 Lark Bunting Place, Longmont, CO 80504 and is currently estimated at $751,471, approximately $168 per square foot. 1520 Lark Bunting Place is a home located in Boulder County with nearby schools including Fall River Elementary School, Trail Ridge Middle School, and Skyline High School.
Ownership History
Date
Name
Owned For
Owner Type
Purchase Details
Closed on
Jun 1, 2018
Sold by
Stanley Michele M and Stanley Johathan B
Bought by
Herzlich Lawrence
Current Estimated Value
Home Financials for this Owner
Home Financials are based on the most recent Mortgage that was taken out on this home.
Original Mortgage
$341,250
Outstanding Balance
$295,124
Interest Rate
4.5%
Mortgage Type
New Conventional
Estimated Equity
$456,347
Purchase Details
Closed on
Mar 13, 2002
Sold by
Nugent Michele M and Stanley Jonathan B
Bought by
Stanley Michele M
Purchase Details
Closed on
Jun 26, 2001
Sold by
Richmond American Homes Of Colorado Inc
Bought by
Nugent Michelle M
Home Financials for this Owner
Home Financials are based on the most recent Mortgage that was taken out on this home.
Original Mortgage
$234,100
Interest Rate
7.2%
Create a Home Valuation Report for This Property
The Home Valuation Report is an in-depth analysis detailing your home's value as well as a comparison with similar homes in the area
Home Values in the Area
Average Home Value in this Area
Purchase History
| Date | Buyer | Sale Price | Title Company |
|---|---|---|---|
| Herzlich Lawrence | $525,000 | First American Title | |
| Stanley Michele M | -- | -- | |
| Nugent Michelle M | $292,627 | Stewart Title |
Source: Public Records
Mortgage History
| Date | Status | Borrower | Loan Amount |
|---|---|---|---|
| Open | Herzlich Lawrence | $341,250 | |
| Previous Owner | Nugent Michelle M | $234,100 |
Source: Public Records
Tax History Compared to Growth
Tax History
| Year | Tax Paid | Tax Assessment Tax Assessment Total Assessment is a certain percentage of the fair market value that is determined by local assessors to be the total taxable value of land and additions on the property. | Land | Improvement |
|---|---|---|---|---|
| 2025 | $4,262 | $46,088 | $7,744 | $38,344 |
| 2024 | $4,262 | $46,088 | $7,744 | $38,344 |
| 2023 | $4,204 | $44,555 | $8,543 | $39,698 |
| 2022 | $3,886 | $39,268 | $6,422 | $32,846 |
| 2021 | $3,936 | $40,398 | $6,607 | $33,791 |
| 2020 | $3,462 | $35,643 | $4,934 | $30,709 |
| 2019 | $3,408 | $35,643 | $4,934 | $30,709 |
| 2018 | $3,058 | $32,198 | $4,968 | $27,230 |
| 2017 | $3,017 | $35,597 | $5,492 | $30,105 |
| 2016 | $2,865 | $29,978 | $7,005 | $22,973 |
| 2015 | $2,731 | $25,146 | $5,811 | $19,335 |
| 2014 | $2,349 | $25,146 | $5,811 | $19,335 |
Source: Public Records
Map
Nearby Homes
- 330 High Point Dr Unit 104
- 1419 Red Mountain Dr Unit 15
- 1419 Red Mountain Dr Unit 116
- 1503 Prairie Hawk Dr
- 1208 Monarch Dr
- 930 Button Rock Dr Unit K59
- 1430 Bluefield Ave
- 1201 Trout Creek Cir
- 1325 Sunshine Ave
- 1219 Cedarwood Dr
- 836 Windflower Dr
- 1405 Rustic Dr
- 1290 Fall River Cir
- 1547 Aspenwood Ln
- 805 Summer Hawk Dr Unit 27
- 805 Summer Hawk Dr Unit NN86
- 805 Summer Hawk Dr Unit C13
- 750 Windflower Dr
- 1458 Ajax Way
- 1435 Rustic Dr
- 1516 Lark Bunting Place
- 1524 Lark Bunting Place
- 1525 Chukar Dr
- 1521 Chukar Dr
- 1529 Chukar Dr
- 1512 Lark Bunting Place
- 1528 Lark Bunting Place
- 1521 Lark Bunting Place
- 1517 Lark Bunting Place
- 1517 Chukar Dr
- 1533 Chukar Dr
- 1525 Lark Bunting Place
- 1508 Lark Bunting Place
- 1532 Lark Bunting Place
- 1511 Lark Bunting Place
- 1513 Chukar Dr
- 1529 Lark Bunting Place
- 1119 Button Rock Ct
- 1504 Lark Bunting Place
- 1530 Chukar Dr