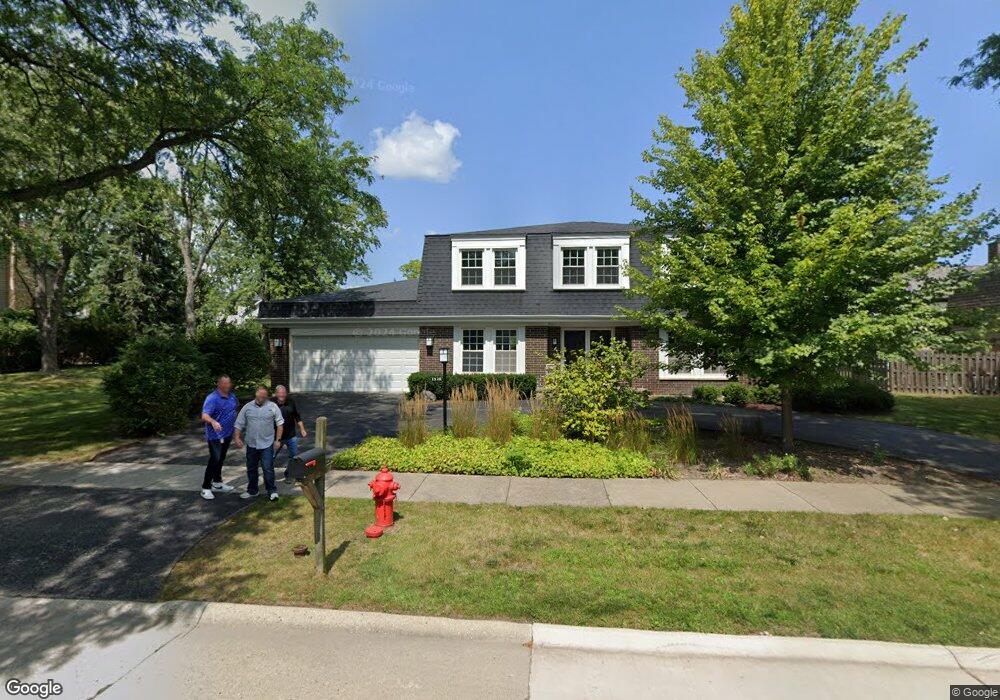
1520 Laurel Ave Unit 4 Deerfield, IL 60015
Estimated Value: $772,000 - $844,000
4
Beds
4
Baths
2,880
Sq Ft
$279/Sq Ft
Est. Value
About This Home
This home is located at 1520 Laurel Ave Unit 4, Deerfield, IL 60015 and is currently estimated at $803,153, approximately $278 per square foot. 1520 Laurel Ave Unit 4 is a home located in Lake County with nearby schools including South Park Elementary School, Charles J Caruso Middle School, and Deerfield High School.
Ownership History
Date
Name
Owned For
Owner Type
Purchase Details
Closed on
Oct 10, 2022
Sold by
Likhter Arthur and Likhter Melissa
Bought by
Likhter Family Revocable Living Trust
Current Estimated Value
Purchase Details
Closed on
Jun 30, 2020
Sold by
Harland Randall S
Bought by
Likhter Arthur and Likhter Melissa
Home Financials for this Owner
Home Financials are based on the most recent Mortgage that was taken out on this home.
Original Mortgage
$397,500
Interest Rate
2.99%
Mortgage Type
New Conventional
Purchase Details
Closed on
Jan 30, 2014
Sold by
Harland Randall S and Harland Dana
Bought by
Harland Randall S and Randall S Harland Trust
Purchase Details
Closed on
Aug 16, 1995
Sold by
Chicago Title & Trust Company
Bought by
Harland Randall S and Harland Dana
Home Financials for this Owner
Home Financials are based on the most recent Mortgage that was taken out on this home.
Original Mortgage
$230,000
Interest Rate
5.62%
Create a Home Valuation Report for This Property
The Home Valuation Report is an in-depth analysis detailing your home's value as well as a comparison with similar homes in the area
Home Values in the Area
Average Home Value in this Area
Purchase History
| Date | Buyer | Sale Price | Title Company |
|---|---|---|---|
| Likhter Family Revocable Living Trust | -- | -- | |
| Likhter Arthur | $530,000 | Chicago Title | |
| Harland Randall S | -- | Chicago Title Insurance Co | |
| Harland Randall S | $365,000 | Chicago Title Insurance Co |
Source: Public Records
Mortgage History
| Date | Status | Borrower | Loan Amount |
|---|---|---|---|
| Previous Owner | Likhter Arthur | $397,500 | |
| Previous Owner | Harland Randall S | $230,000 |
Source: Public Records
Tax History Compared to Growth
Tax History
| Year | Tax Paid | Tax Assessment Tax Assessment Total Assessment is a certain percentage of the fair market value that is determined by local assessors to be the total taxable value of land and additions on the property. | Land | Improvement |
|---|---|---|---|---|
| 2024 | $17,783 | $205,206 | $58,274 | $146,932 |
| 2023 | $16,757 | $196,935 | $55,925 | $141,010 |
| 2022 | $16,757 | $182,835 | $60,068 | $122,767 |
| 2021 | $15,808 | $176,278 | $57,914 | $118,364 |
| 2020 | $15,204 | $176,649 | $58,036 | $118,613 |
| 2019 | $16,043 | $189,981 | $57,938 | $132,043 |
| 2018 | $16,474 | $214,179 | $61,409 | $152,770 |
| 2017 | $17,284 | $213,496 | $61,213 | $152,283 |
| 2016 | $16,812 | $205,423 | $58,898 | $146,525 |
| 2015 | $16,473 | $193,013 | $55,340 | $137,673 |
| 2014 | $16,448 | $190,047 | $55,736 | $134,311 |
| 2012 | $16,043 | $188,370 | $55,244 | $133,126 |
Source: Public Records
Map
Nearby Homes
- 245 Kenmore Ave
- 56 Birchwood Ave
- 19 Burning Tree Ln
- 214 Burr Oak Ave
- 505 Susan Ln
- 517 Appletree Ln
- 312 Pine St
- 1131 Laurel Ave
- 677 Timber Hill Rd
- 730 Castlewood Ln
- 816 Appletree Ln
- 1027 Central Ave
- 1009 Central Ave
- 440 Huehl Rd
- 455 Laburnum Dr
- 956 Brookside Ln
- 3549 Bayberry Dr
- 926 Cedar St
- 435 Elm St Unit 4G
- 441 Elm St Unit 3A
- 1510 Laurel Ave
- 1530 Laurel Ave
- 216 Kenmore Ave
- 1555 Samanthas Way
- 1500 Laurel Ave
- 1521 Laurel Ave Unit 4
- 1511 Laurel Ave
- 1540 Laurel Ave
- 1537 Laurel Ave
- 1565 Samanthas Way
- 240 Kenmore Ave
- 1501 Laurel Ave
- 1545 Laurel Ave
- 1575 Samanthas Way
- 149 Aspen Way
- 1550 Laurel Ave
- 140 Kenmore Ave
- 150 Aspen Way
- 1454 Laurel Ave
- 211 Kenmore Ave