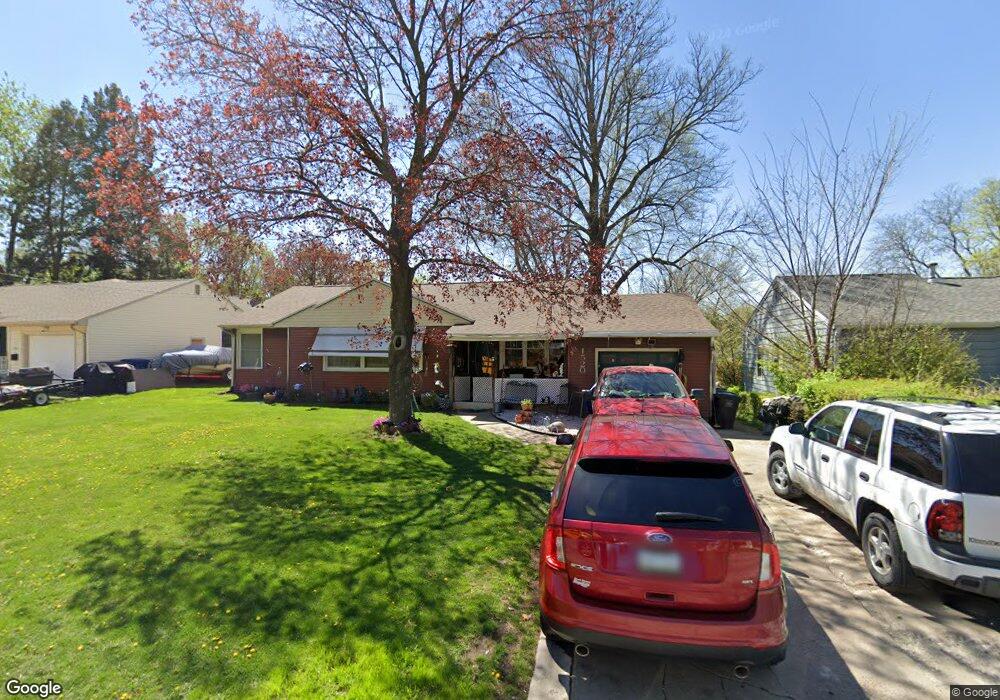
1520 Merle Hay Rd Des Moines, IA 50311
Merle Hay NeighborhoodEstimated Value: $228,000 - $242,000
3
Beds
2
Baths
1,356
Sq Ft
$174/Sq Ft
Est. Value
About This Home
This home is located at 1520 Merle Hay Rd, Des Moines, IA 50311 and is currently estimated at $236,197, approximately $174 per square foot. 1520 Merle Hay Rd is a home located in Polk County with nearby schools including Windsor Elementary School, Merrill Middle School, and Roosevelt High School.
Ownership History
Date
Name
Owned For
Owner Type
Purchase Details
Closed on
Jul 30, 2002
Sold by
Deutsche Bank National Trust Company
Bought by
Barry Larry W
Current Estimated Value
Home Financials for this Owner
Home Financials are based on the most recent Mortgage that was taken out on this home.
Original Mortgage
$85,000
Outstanding Balance
$35,854
Interest Rate
6.64%
Estimated Equity
$200,343
Purchase Details
Closed on
Jul 22, 2002
Sold by
Kile Rebecca L and Grow Howard R
Bought by
Huskic Sahzudin and Huskic Fahreta
Home Financials for this Owner
Home Financials are based on the most recent Mortgage that was taken out on this home.
Original Mortgage
$85,000
Outstanding Balance
$35,854
Interest Rate
6.64%
Estimated Equity
$200,343
Purchase Details
Closed on
Jan 4, 2002
Sold by
Ellis Paul Thomas and Ellis Katie
Bought by
Kile Rebecca L
Purchase Details
Closed on
Dec 21, 2001
Sold by
Kile Rebecca L
Bought by
Kile Rebecca L
Create a Home Valuation Report for This Property
The Home Valuation Report is an in-depth analysis detailing your home's value as well as a comparison with similar homes in the area
Home Values in the Area
Average Home Value in this Area
Purchase History
| Date | Buyer | Sale Price | Title Company |
|---|---|---|---|
| Barry Larry W | -- | -- | |
| Huskic Sahzudin | $89,500 | -- | |
| Kile Rebecca L | -- | -- | |
| Kile Rebecca L | $47,500 | -- |
Source: Public Records
Mortgage History
| Date | Status | Borrower | Loan Amount |
|---|---|---|---|
| Open | Huskic Sahzudin | $85,000 |
Source: Public Records
Tax History Compared to Growth
Tax History
| Year | Tax Paid | Tax Assessment Tax Assessment Total Assessment is a certain percentage of the fair market value that is determined by local assessors to be the total taxable value of land and additions on the property. | Land | Improvement |
|---|---|---|---|---|
| 2025 | $3,714 | $230,500 | $47,700 | $182,800 |
| 2024 | $3,714 | $206,300 | $42,000 | $164,300 |
| 2023 | $4,036 | $206,300 | $42,000 | $164,300 |
| 2022 | $4,002 | $180,100 | $37,900 | $142,200 |
| 2021 | $3,814 | $180,100 | $37,900 | $142,200 |
| 2020 | $3,956 | $161,400 | $33,700 | $127,700 |
| 2019 | $3,644 | $161,400 | $33,700 | $127,700 |
| 2018 | $3,602 | $144,100 | $29,500 | $114,600 |
| 2017 | $3,220 | $144,100 | $29,500 | $114,600 |
| 2016 | $3,132 | $127,600 | $25,700 | $101,900 |
| 2015 | $3,132 | $127,600 | $25,700 | $101,900 |
| 2014 | $2,778 | $117,400 | $23,200 | $94,200 |
Source: Public Records
Map
Nearby Homes
- 1528 Merle Hay Rd
- 1516 Merle Hay Rd
- 1609 Cummins Pkwy
- 1512 Merle Hay Rd
- 1605 Cummins Pkwy
- 1521 Merle Hay Rd
- 1517 Merle Hay Rd
- 1529 Merle Hay Rd
- 5801 Crown Ln
- 1504 Merle Hay Rd
- 1513 Merle Hay Rd
- 1601 Cummins Pkwy
- 5820 Crown Ln
- 1509 Merle Hay Rd
- 1500 Merle Hay Rd
- 1544 Merle Hay Rd
- 5736 Clark Blvd
- 5734 Clark Blvd
- 1519 Cummins Pkwy
- 1505 Merle Hay Rd