Estimated Value: $186,000 - $221,000
3
Beds
2
Baths
1,138
Sq Ft
$175/Sq Ft
Est. Value
About This Home
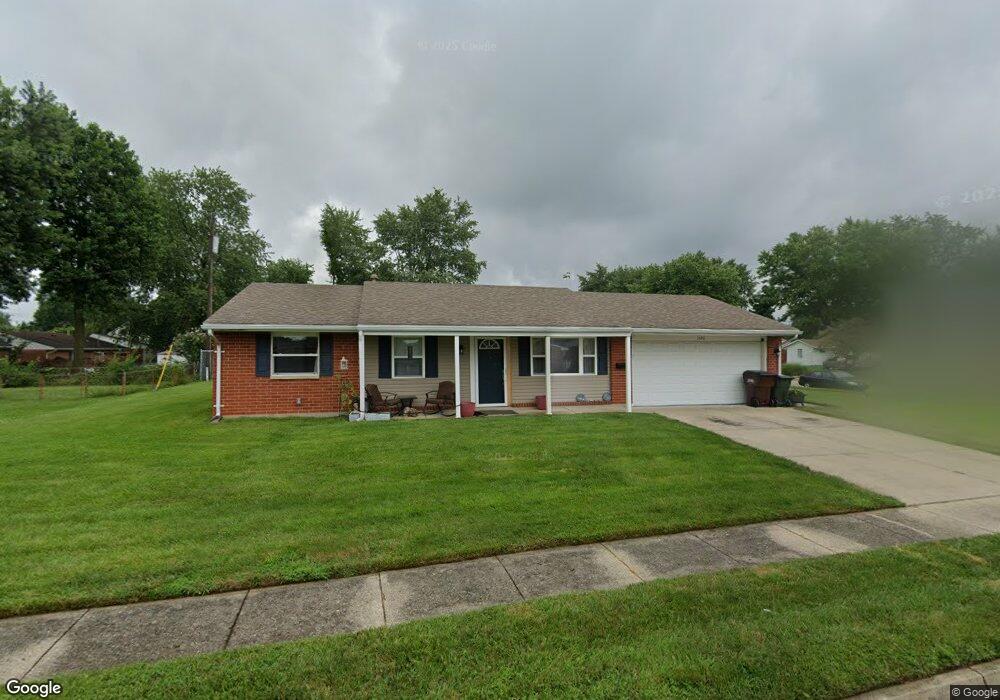
This home is located at 1520 Oshaughnesy Dr, Xenia, OH 45385 and is currently estimated at $199,401, approximately $175 per square foot. 1520 Oshaughnesy Dr is a home located in Greene County with nearby schools including Xenia High School, Summit Academy Community School for Alternative Learners - Xenia, and Legacy Christian Academy.
Ownership History
Date
Name
Owned For
Owner Type
Purchase Details
Closed on
Oct 14, 2010
Sold by
Secretary Of Housing & Urban Development
Bought by
Ohio Valley Property Management Llc
Current Estimated Value
Purchase Details
Closed on
May 10, 2010
Sold by
Bac Home Loans Servicing Lp
Bought by
The Secretary Of Housing & Urban Develop
Purchase Details
Closed on
Apr 20, 2010
Sold by
Anderson Steven F
Bought by
Bac Home Loans Servicing Lp and Countrywid Ehome Loans Servicing Lp
Purchase Details
Closed on
Feb 27, 1998
Sold by
Rowland Roger L and Rowland Patricia M
Bought by
Anderson Steven F
Home Financials for this Owner
Home Financials are based on the most recent Mortgage that was taken out on this home.
Original Mortgage
$71,450
Interest Rate
6.95%
Mortgage Type
FHA
Create a Home Valuation Report for This Property
The Home Valuation Report is an in-depth analysis detailing your home's value as well as a comparison with similar homes in the area
Home Values in the Area
Average Home Value in this Area
Purchase History
| Date | Buyer | Sale Price | Title Company |
|---|---|---|---|
| Ohio Valley Property Management Llc | $45,000 | Attorney | |
| The Secretary Of Housing & Urban Develop | -- | Attorney | |
| Bac Home Loans Servicing Lp | $54,000 | Attorney | |
| Anderson Steven F | $71,500 | -- |
Source: Public Records
Mortgage History
| Date | Status | Borrower | Loan Amount |
|---|---|---|---|
| Previous Owner | Anderson Steven F | $71,450 |
Source: Public Records
Tax History Compared to Growth
Tax History
| Year | Tax Paid | Tax Assessment Tax Assessment Total Assessment is a certain percentage of the fair market value that is determined by local assessors to be the total taxable value of land and additions on the property. | Land | Improvement |
|---|---|---|---|---|
| 2024 | $2,049 | $47,880 | $13,020 | $34,860 |
| 2023 | $2,049 | $47,880 | $13,020 | $34,860 |
| 2022 | $1,690 | $33,690 | $7,660 | $26,030 |
| 2021 | $1,713 | $33,690 | $7,660 | $26,030 |
| 2020 | $1,641 | $33,690 | $7,660 | $26,030 |
| 2019 | $1,431 | $27,650 | $7,550 | $20,100 |
| 2018 | $1,436 | $27,650 | $7,550 | $20,100 |
| 2017 | $1,321 | $27,650 | $7,550 | $20,100 |
| 2016 | $1,321 | $24,960 | $7,550 | $17,410 |
| 2015 | $1,325 | $24,960 | $7,550 | $17,410 |
| 2014 | $1,269 | $24,960 | $7,550 | $17,410 |
Source: Public Records
Map
Nearby Homes
- 1568 Cheyenne Dr
- 1618 Navajo Dr
- 1653 Seneca Dr
- 2758 Wyoming Dr
- 161 Montana Dr
- 1144 Rockwell Dr
- 1778 Arapaho Dr
- 1769 Gayhart Dr
- 219 Kansas Dr
- 1403 Texas Dr
- 1829 Gayhart Dr
- 121 S Progress Dr
- 414 Whisper Ln
- 2142 Michigan Dr
- 1272 Bellbrook Ave
- 1208 Bellbrook Ave
- 1342 Kylemore Dr
- 1908 Whitt St
- 1866 Roxbury Dr
- 2545 Harmony Dr
- 1480 Oshaughnesy Dr
- 1471 Seneca Dr
- 1468 Oshaughnesy Dr
- 1533 Oshaughnesy Dr
- 1545 Oshaughnesy Dr
- 1481 Oshaughnesy Dr
- 1519 Oshaughnesy Dr
- 1457 Seneca Dr
- 1493 Oshaughnesy Dr
- 1471 Oshaughnesy Dr
- 1454 Oshaughnesy Dr
- 1521 Seneca Dr
- 1507 Oshaughnesy Dr
- 1457 Oshaughnesy Dr
- 1443 Seneca Dr
- 1440 Oshaughnesy Dr
- 2066 Wyandot Dr
- 1443 Oshaughnesy Dr
- 2080 Wyandot Dr
- 2052 Wyandot Dr