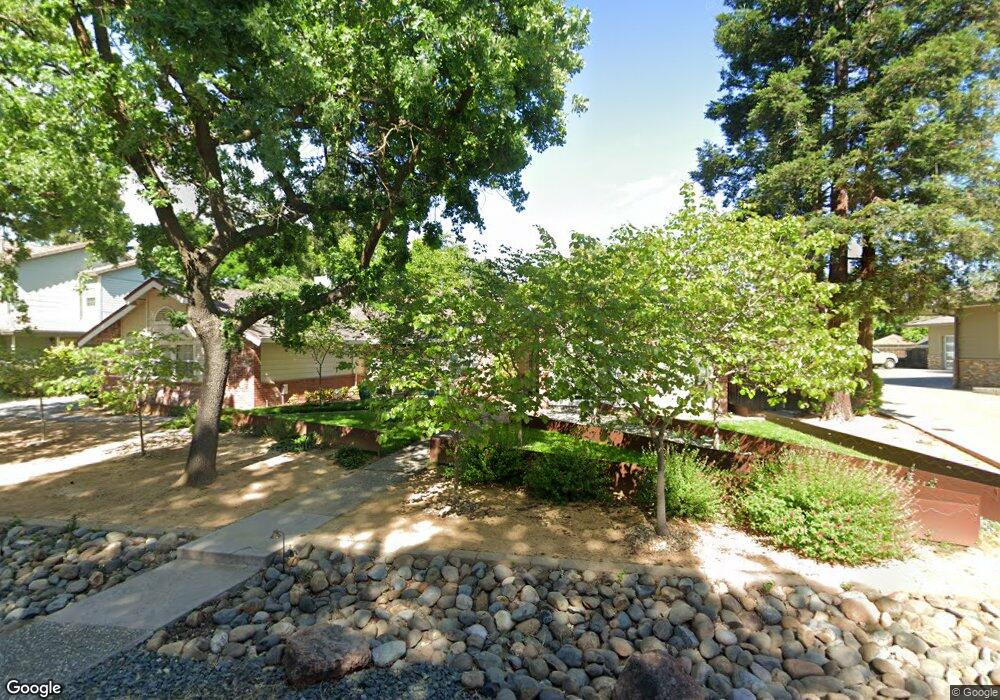
1520 Rialto Ln Davis, CA 95618
South Davis NeighborhoodEstimated Value: $1,236,000 - $1,498,000
About This Home
This home is located at 1520 Rialto Ln, Davis, CA 95618 and is currently estimated at $1,319,444, approximately $430 per square foot. 1520 Rialto Ln is a home located in Yolo County with nearby schools including Marguerite Montgomery Elementary School, Frances Ellen Watkins Harper Junior High School, and Davis Senior High School.
Ownership History
We collect this data history from publicly available records. To have your information removed, we recommend requesting removal directly through your county’s website.
Purchase Details
Home Financials for this Owner
Home Financials are based on the most recent Mortgage that was taken out on this home.Purchase Details
Purchase Details
Home Financials for this Owner
Home Financials are based on the most recent Mortgage that was taken out on this home.Home Values in the Area
Average Home Value in this Area
Purchase History
We collect this data history from publicly available records. To have your information removed, we recommend requesting removal directly through your county’s website.
| Date | Buyer | Sale Price | Title Company |
|---|---|---|---|
| -- | Fidelity Natl Title Co Of Ca | ||
| -- | Fidelity Natl Title Co Of Ca | ||
| -- | None Available | ||
| -- | None Available | ||
| $389,000 | Fidelity National Title Co |
Mortgage History
We collect this data history from publicly available records. To have your information removed, we recommend requesting removal directly through your county’s website.
| Date | Status | Borrower | Loan Amount |
|---|---|---|---|
| Closed | $412,500 | ||
| Closed | $311,200 | ||
| Closed | $58,300 |
Tax History
We collect this data history from publicly available records. To have your information removed, we recommend requesting removal directly through your county’s website.
| Year | Tax Paid | Tax Assessment Tax Assessment Total Assessment is a certain percentage of the fair market value that is determined by local assessors to be the total taxable value of land and additions on the property. | Land | Improvement |
|---|---|---|---|---|
| 2025 | $8,249 | $621,116 | $223,534 | $397,582 |
| 2023 | $8,056 | $596,999 | $214,854 | $382,145 |
| 2022 | $7,720 | $585,294 | $210,642 | $374,652 |
| 2021 | $7,540 | $573,818 | $206,512 | $367,306 |
| 2020 | $7,420 | $567,935 | $204,395 | $363,540 |
| 2019 | $7,095 | $556,800 | $200,388 | $356,412 |
| 2018 | $6,604 | $545,883 | $196,459 | $349,424 |
| 2017 | $6,466 | $535,180 | $192,607 | $342,573 |
| 2016 | $6,274 | $524,687 | $188,831 | $335,856 |
| 2015 | $6,159 | $516,807 | $185,995 | $330,812 |
| 2014 | $6,055 | $506,684 | $182,352 | $324,332 |
Map
- 2514 Regatta Ct
- 43120 Montgomery Ave
- 1162 Drummond Ave
- 3203 Lillard Dr
- 1136 Los Robles St
- 912 Los Robles St
- 1175 Greene Terrace
- 2780 Brentwood Place
- 2230 Halsey Cir
- 1174 Greene Terrace
- 3030 Albany Ave
- 3718 Maidu Place
- 124 Hedy Ln
- 143 Louise Ln
- 86 Lyle Way
- 4125 Hackberry Place
- 3948 Cowell Blvd
- 2736 5th St Unit A
- 2736 5th St
- 2746 5th St
- 1514 Rialto Ln
- 1526 Rialto Ln
- 1519 Rialto Ln
- 1517 Gateway Ct
- 1513 Rialto Ln
- 1532 Rialto Ln
- 1508 Rialto Ln
- 1505 Gateway Ct
- 1507 Rialto Ln
- 1539 Rialto Ln
- 1538 Rialto Ln
- 1563 Rialto Ln
- 1516 Gateway Ct
- 1502 Rialto Ln
- 1501 Rialto Ln
- 1504 Gateway Ct
- 1569 Rialto Ln
- 1544 Rialto Ln
- 1550 Rialto Ln
- 1556 Rialto Ln
Ask me questions while you tour the home.