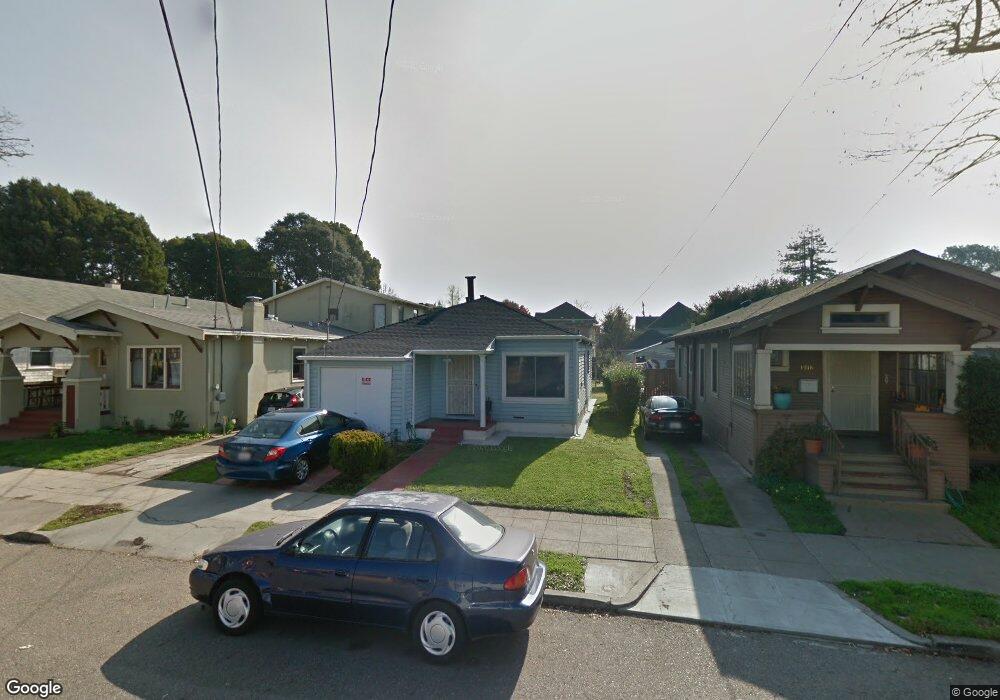
1520 Tyler St Berkeley, CA 94703
South Berkeley NeighborhoodEstimated Value: $803,000 - $1,027,000
2
Beds
1
Bath
880
Sq Ft
$1,012/Sq Ft
Est. Value
About This Home
This home is located at 1520 Tyler St, Berkeley, CA 94703 and is currently estimated at $890,862, approximately $1,012 per square foot. 1520 Tyler St is a home located in Alameda County with nearby schools including Malcolm X Elementary School, Washington Elementary School, and Oxford Elementary School.
Ownership History
Date
Name
Owned For
Owner Type
Purchase Details
Closed on
Mar 29, 2012
Sold by
Oliva Griselda G
Bought by
Oliva Griselda G and Griselda G Oliva 2003 Trust
Current Estimated Value
Purchase Details
Closed on
Nov 1, 2011
Sold by
Oliva Griselda G and Griselda G Oliva 2003 Trust
Bought by
Oliva Griselda G
Home Financials for this Owner
Home Financials are based on the most recent Mortgage that was taken out on this home.
Original Mortgage
$219,500
Outstanding Balance
$22,104
Interest Rate
3.95%
Mortgage Type
New Conventional
Estimated Equity
$868,758
Purchase Details
Closed on
Dec 24, 2003
Sold by
Oliva Griselda G
Bought by
Oliva Griselda G and Griselda G Oliva 2003 Trust
Purchase Details
Closed on
Aug 22, 2003
Sold by
Henry Maxine and Richardson Eva
Bought by
Oliva Griselda G
Home Financials for this Owner
Home Financials are based on the most recent Mortgage that was taken out on this home.
Original Mortgage
$317,300
Interest Rate
5.87%
Mortgage Type
Purchase Money Mortgage
Create a Home Valuation Report for This Property
The Home Valuation Report is an in-depth analysis detailing your home's value as well as a comparison with similar homes in the area
Home Values in the Area
Average Home Value in this Area
Purchase History
| Date | Buyer | Sale Price | Title Company |
|---|---|---|---|
| Oliva Griselda G | -- | None Available | |
| Oliva Griselda G | -- | Servicelink | |
| Oliva Griselda G | -- | -- | |
| Oliva Griselda G | $334,000 | Fidelity National Title Co |
Source: Public Records
Mortgage History
| Date | Status | Borrower | Loan Amount |
|---|---|---|---|
| Open | Oliva Griselda G | $219,500 | |
| Closed | Oliva Griselda G | $317,300 |
Source: Public Records
Tax History
| Year | Tax Paid | Tax Assessment Tax Assessment Total Assessment is a certain percentage of the fair market value that is determined by local assessors to be the total taxable value of land and additions on the property. | Land | Improvement |
|---|---|---|---|---|
| 2025 | $7,234 | $467,850 | $142,455 | $332,395 |
| 2024 | $7,234 | $458,541 | $139,662 | $325,879 |
| 2023 | $7,077 | $456,414 | $136,924 | $319,490 |
| 2022 | $6,948 | $440,465 | $134,239 | $313,226 |
| 2021 | $6,959 | $431,694 | $131,608 | $307,086 |
| 2020 | $6,614 | $434,200 | $130,260 | $303,940 |
| 2019 | $6,378 | $425,685 | $127,705 | $297,980 |
| 2018 | $6,269 | $417,338 | $125,201 | $292,137 |
| 2017 | $6,027 | $409,156 | $122,747 | $286,409 |
| 2016 | $5,843 | $401,133 | $120,340 | $280,793 |
| 2015 | $5,765 | $395,108 | $118,532 | $276,576 |
| 2014 | $5,680 | $387,368 | $116,210 | $271,158 |
Source: Public Records
Map
Nearby Homes
- 1507 Prince St
- 3101 Sacramento St
- 3110 California St
- 3114 California St
- 3138 California St
- 1535 Julia St
- 1646 Ashby Ave
- 2922 Stanton St
- 3214 California St
- 3224 Sacramento St
- 1314 Ashby Ave
- 2926 Ellis St
- 1530 Stuart St
- 3032 Mabel St
- 2790 Sacramento St
- 3233 Ellis St
- 2782 Sacramento St
- 2774 Sacramento St
- 2758 Sacramento St
- 1450 Ward St
- 1524 Tyler St
- 1516 Tyler St
- 1530 Tyler St
- 1512 Tyler St
- 1534 Tyler St
- 1532 Tyler St Unit C
- 1532 Tyler St Unit B
- 1510 Tyler St
- 1523 Prince St
- 1517 Prince St
- 1531 Prince St
- 1536 Tyler St
- 1533 Prince St Unit 1533-A Prince Street
- 1533 Prince St
- 1506 Tyler St
- 1515 Prince St Unit A
- 1515 Prince St Unit B
- 1515 Prince St
- 1515 Prince St
- 1535 Prince St
Your Personal Tour Guide
Ask me questions while you tour the home.