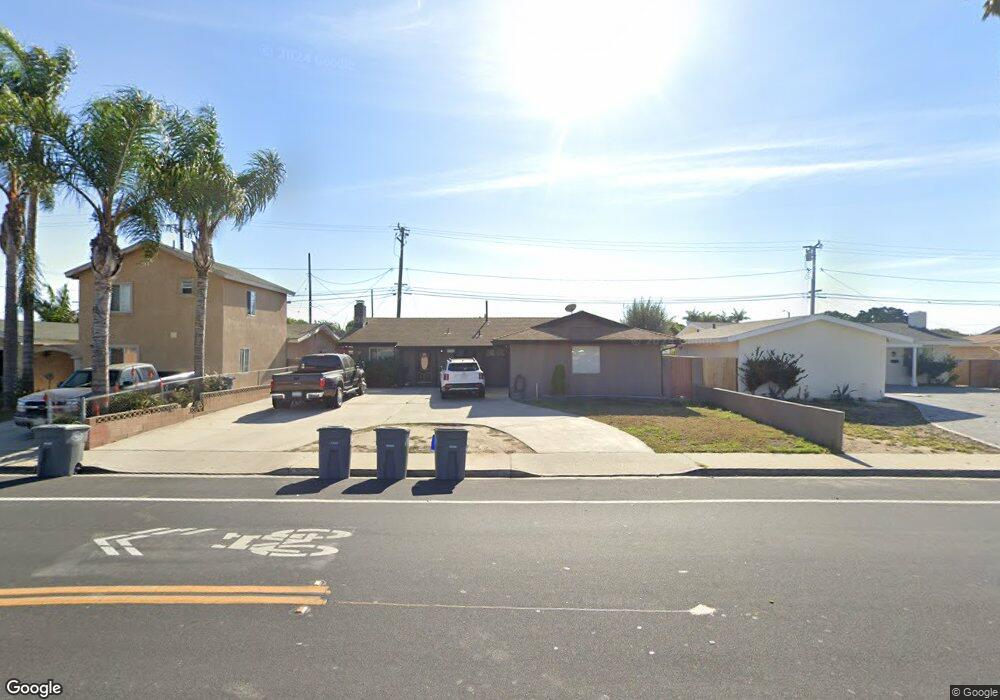
1520 W Hemlock St Oxnard, CA 93035
Marina West NeighborhoodEstimated Value: $574,879 - $689,000
3
Beds
2
Baths
1,148
Sq Ft
$551/Sq Ft
Est. Value
About This Home
This home is located at 1520 W Hemlock St, Oxnard, CA 93035 and is currently estimated at $632,720, approximately $551 per square foot. 1520 W Hemlock St is a home located in Ventura County with nearby schools including Marina West Elementary School, Oxnard High School, and St. Anthony's Elementary School.
Ownership History
Date
Name
Owned For
Owner Type
Purchase Details
Closed on
Mar 2, 2020
Sold by
Lehne Daniel B
Bought by
Lehne Daniel and Lehne Jessica
Current Estimated Value
Home Financials for this Owner
Home Financials are based on the most recent Mortgage that was taken out on this home.
Original Mortgage
$330,357
Outstanding Balance
$293,131
Interest Rate
3.6%
Mortgage Type
VA
Estimated Equity
$339,589
Purchase Details
Closed on
Sep 26, 2016
Sold by
Lehne Daniel B and Lehne Daniel
Bought by
Lehne Daniel B
Home Financials for this Owner
Home Financials are based on the most recent Mortgage that was taken out on this home.
Original Mortgage
$284,075
Interest Rate
3.46%
Mortgage Type
VA
Purchase Details
Closed on
Aug 25, 2011
Sold by
Brown Joseph
Bought by
Lehne Daniel
Home Financials for this Owner
Home Financials are based on the most recent Mortgage that was taken out on this home.
Original Mortgage
$248,224
Interest Rate
4.15%
Mortgage Type
VA
Purchase Details
Closed on
Mar 2, 2006
Sold by
Buntin Elroy W and Buntin Ruth L
Bought by
Elroy W & Ruth L Buntin Revocable Tr and Buntin Ruth L
Create a Home Valuation Report for This Property
The Home Valuation Report is an in-depth analysis detailing your home's value as well as a comparison with similar homes in the area
Home Values in the Area
Average Home Value in this Area
Purchase History
| Date | Buyer | Sale Price | Title Company |
|---|---|---|---|
| Lehne Daniel | -- | Lawyer Title | |
| Lehne Daniel B | -- | None Available | |
| Lehne Daniel B | -- | None Available | |
| Lehne Daniel | $243,000 | Lawyers Title | |
| Elroy W & Ruth L Buntin Revocable Tr | -- | None Available |
Source: Public Records
Mortgage History
| Date | Status | Borrower | Loan Amount |
|---|---|---|---|
| Open | Lehne Daniel | $330,357 | |
| Closed | Lehne Daniel B | $284,075 | |
| Previous Owner | Lehne Daniel | $248,224 |
Source: Public Records
Tax History
| Year | Tax Paid | Tax Assessment Tax Assessment Total Assessment is a certain percentage of the fair market value that is determined by local assessors to be the total taxable value of land and additions on the property. | Land | Improvement |
|---|---|---|---|---|
| 2025 | $3,728 | $305,206 | $152,604 | $152,602 |
| 2024 | $3,728 | $299,222 | $149,612 | $149,610 |
| 2023 | $3,593 | $293,355 | $146,678 | $146,677 |
| 2022 | $3,486 | $287,603 | $143,802 | $143,801 |
| 2021 | $3,458 | $281,964 | $140,982 | $140,982 |
| 2020 | $3,522 | $279,076 | $139,538 | $139,538 |
| 2019 | $3,423 | $273,604 | $136,802 | $136,802 |
| 2018 | $3,375 | $268,240 | $134,120 | $134,120 |
| 2017 | $3,204 | $262,982 | $131,491 | $131,491 |
| 2016 | $3,093 | $257,826 | $128,913 | $128,913 |
| 2015 | $3,126 | $253,956 | $126,978 | $126,978 |
| 2014 | $3,092 | $248,984 | $124,492 | $124,492 |
Source: Public Records
Map
Nearby Homes
- 257 E Garden Green
- 269 E Elfin Green
- 236 E Bay Blvd
- 1431 Casa San Carlos Ln Unit B
- 137 E Garden Green
- 13 W Garden Green
- 20 W Fiesta Green
- 31 W Delta Green
- 75 W Fiesta Green
- 2400 W Hemlock St
- 102 W Alta Green
- 2730 Jill Place
- 1501 Pisco Ln
- 175 W Bowling Green
- 2706 Bolker Dr
- 169 W Alta Green
- 2715 Jill Place
- 162 W Alta Green
- 1720 Elsinore Cir
- 221 Sharon Ln
- 1510 W Hemlock St
- 1530 W Hemlock St
- 327 E Garden Green
- 323 E Garden Green
- 1540 W Hemlock St
- 1500 W Hemlock St
- 2699 N Ventura Rd
- 333 E Garden Green
- 313 E Garden Green
- 2689 N Ventura Rd
- 1930 Ontario St
- 1550 W Hemlock St
- 1931 Ontario St
- 307 E Garden Green
- 1931 S Ventura Rd
- 326 E Garden Green
- 2679 S Ventura Rd
- 2679 N Ventura Rd
- 1930 Piedmont St
- 1600 W Hemlock St
Your Personal Tour Guide
Ask me questions while you tour the home.