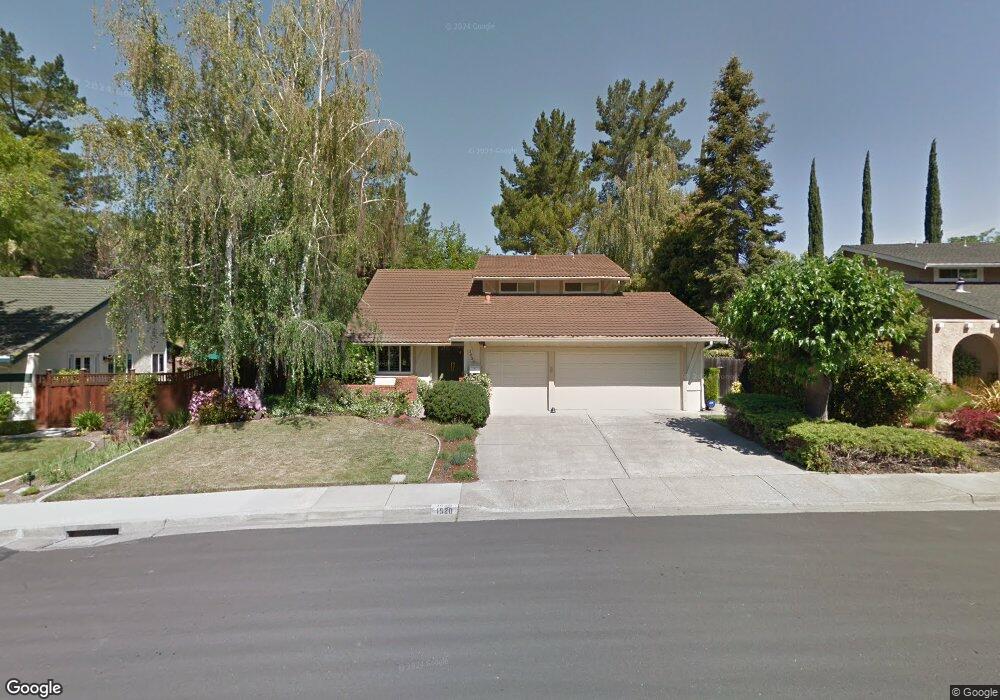
1520 Whitecliff Way Walnut Creek, CA 94596
Estimated Value: $1,749,000 - $1,876,000
5
Beds
3
Baths
2,604
Sq Ft
$698/Sq Ft
Est. Value
About This Home
This home is located at 1520 Whitecliff Way, Walnut Creek, CA 94596 and is currently estimated at $1,816,809, approximately $697 per square foot. 1520 Whitecliff Way is a home located in Contra Costa County with nearby schools including Murwood Elementary School, Walnut Creek Intermediate School, and Las Lomas High School.
Ownership History
Date
Name
Owned For
Owner Type
Purchase Details
Closed on
Apr 26, 2024
Sold by
Pelattini Bahram and Peymandoust Leyla
Bought by
Nakav Alix and Nakav Idan
Current Estimated Value
Home Financials for this Owner
Home Financials are based on the most recent Mortgage that was taken out on this home.
Original Mortgage
$1,464,000
Outstanding Balance
$1,443,433
Interest Rate
6.87%
Mortgage Type
New Conventional
Estimated Equity
$373,376
Purchase Details
Closed on
Mar 4, 2020
Sold by
Peymandoust Leyla and Pelattini Bahram
Bought by
Pro Lnp Consulting Llc
Purchase Details
Closed on
Apr 24, 2012
Sold by
Calloway Wesley G and Calloway Gloria A
Bought by
Peymandoust Leyla and Pelattini Bahram
Home Financials for this Owner
Home Financials are based on the most recent Mortgage that was taken out on this home.
Original Mortgage
$737,047
Interest Rate
3.94%
Mortgage Type
FHA
Create a Home Valuation Report for This Property
The Home Valuation Report is an in-depth analysis detailing your home's value as well as a comparison with similar homes in the area
Home Values in the Area
Average Home Value in this Area
Purchase History
| Date | Buyer | Sale Price | Title Company |
|---|---|---|---|
| Nakav Alix | $1,830,000 | Chicago Title | |
| Pro Lnp Consulting Llc | -- | None Available | |
| Peymandoust Leyla | $785,000 | Placer Title Company |
Source: Public Records
Mortgage History
| Date | Status | Borrower | Loan Amount |
|---|---|---|---|
| Open | Nakav Alix | $1,464,000 | |
| Previous Owner | Peymandoust Leyla | $737,047 |
Source: Public Records
Tax History Compared to Growth
Tax History
| Year | Tax Paid | Tax Assessment Tax Assessment Total Assessment is a certain percentage of the fair market value that is determined by local assessors to be the total taxable value of land and additions on the property. | Land | Improvement |
|---|---|---|---|---|
| 2025 | $11,823 | $1,866,600 | $1,275,000 | $591,600 |
| 2024 | $11,543 | $966,660 | $701,909 | $264,751 |
| 2023 | $11,543 | $947,707 | $688,147 | $259,560 |
| 2022 | $11,292 | $929,125 | $674,654 | $254,471 |
| 2021 | $10,987 | $910,908 | $661,426 | $249,482 |
| 2019 | $10,762 | $883,891 | $641,808 | $242,083 |
| 2018 | $10,399 | $866,561 | $629,224 | $237,337 |
| 2017 | $10,209 | $849,571 | $616,887 | $232,684 |
| 2016 | $10,019 | $832,914 | $604,792 | $228,122 |
| 2015 | $9,792 | $820,404 | $595,708 | $224,696 |
| 2014 | $9,680 | $804,334 | $584,039 | $220,295 |
Source: Public Records
Map
Nearby Homes
- 1092 Hillendale Ct
- 716 Rosewood Dr
- 1096 Mountain View Blvd
- 421 Twin Oaks Ln
- 2409 Lavender Dr
- 31 Arabian Ct
- 1305 Chesterton Way
- 32 Pacer Place
- 1555 Pebblebrook Ct
- 2129 Youngs Ct
- 2673 Velvet Way
- 628 Sugarloaf Ct
- 1080 Scots Ln
- 172 Rudgear Dr
- 1101 Scots Ln
- 2128 San Miguel Dr
- 189 Rudgear Dr
- 721 Fair Oaks Dr
- 420 Livorna Rd
- 47 Kentfield Ct
- 1530 Whitecliff Way
- 1510 Whitecliff Way
- 1900 Kingridge Ct
- 1538 Whitecliff Way
- 1500 Whitecliff Way
- 1521 Whitecliff Way
- 1511 Whitecliff Way
- 1531 Whitecliff Way
- 1501 Whitecliff Way
- 1920 Kingridge Ct
- 1910 Kingridge Ct
- 1930 Kingridge Ct
- 1490 Whitecliff Way
- 1541 Whitecliff Way
- 1940 Kingridge Ct
- 1958 Amesbury Ct
- 1602 Whitecliff Way
- 1482 Whitecliff Way
- 1951 Amesbury Ct
- 1953 Woodbury Ct