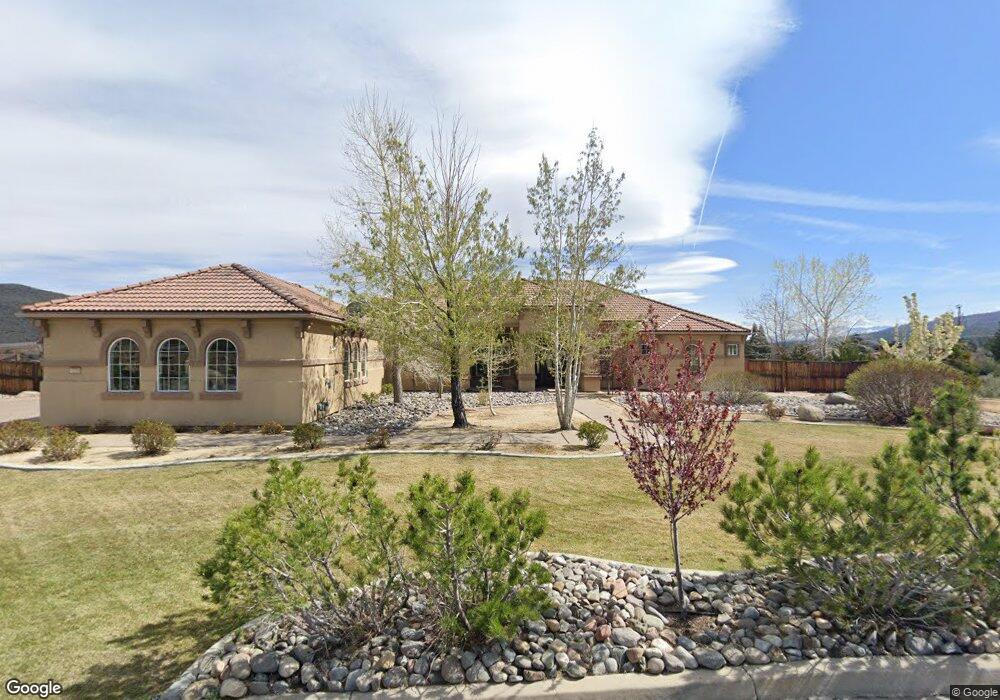
15200 Chateau Ave Reno, NV 89511
Summit Sierra NeighborhoodEstimated Value: $1,654,063 - $1,797,000
5
Beds
4
Baths
3,666
Sq Ft
$471/Sq Ft
Est. Value
About This Home
This home is located at 15200 Chateau Ave, Reno, NV 89511 and is currently estimated at $1,725,516, approximately $470 per square foot. 15200 Chateau Ave is a home located in Washoe County with nearby schools including Ted Hunsburger Elementary School, Marce Herz Middle School, and Galena High School.
Ownership History
Date
Name
Owned For
Owner Type
Purchase Details
Closed on
Mar 14, 2012
Sold by
Moll Kenneth L and Huang Emily S
Bought by
Moll Kenneth Lane and Huang Memily Shihyung
Current Estimated Value
Purchase Details
Closed on
Jul 17, 2008
Sold by
Trificana Elizabeth M
Bought by
Moll Kenneth L and Huang Emily S
Home Financials for this Owner
Home Financials are based on the most recent Mortgage that was taken out on this home.
Original Mortgage
$417,000
Interest Rate
6.07%
Mortgage Type
Unknown
Purchase Details
Closed on
Mar 14, 2006
Sold by
Patterson Rickie
Bought by
Trificana Elizabeth M
Home Financials for this Owner
Home Financials are based on the most recent Mortgage that was taken out on this home.
Original Mortgage
$671,481
Interest Rate
6.33%
Mortgage Type
Fannie Mae Freddie Mac
Create a Home Valuation Report for This Property
The Home Valuation Report is an in-depth analysis detailing your home's value as well as a comparison with similar homes in the area
Home Values in the Area
Average Home Value in this Area
Purchase History
| Date | Buyer | Sale Price | Title Company |
|---|---|---|---|
| Moll Kenneth Lane | -- | None Available | |
| Moll Kenneth L | $689,500 | Western Title Inc Ridge | |
| Trificana Elizabeth M | -- | First American Title | |
| Trificana Elizabeth M | $839,500 | First American Title |
Source: Public Records
Mortgage History
| Date | Status | Borrower | Loan Amount |
|---|---|---|---|
| Closed | Moll Kenneth L | $417,000 | |
| Previous Owner | Trificana Elizabeth M | $671,481 |
Source: Public Records
Tax History Compared to Growth
Tax History
| Year | Tax Paid | Tax Assessment Tax Assessment Total Assessment is a certain percentage of the fair market value that is determined by local assessors to be the total taxable value of land and additions on the property. | Land | Improvement |
|---|---|---|---|---|
| 2025 | $9,646 | $361,635 | $110,390 | $251,245 |
| 2024 | $8,931 | $347,381 | $94,605 | $252,776 |
| 2023 | $8,931 | $336,773 | $98,910 | $237,863 |
| 2022 | $8,273 | $282,943 | $84,455 | $198,488 |
| 2021 | $7,664 | $257,122 | $60,130 | $196,992 |
| 2020 | $7,210 | $259,224 | $62,125 | $197,099 |
| 2019 | $6,866 | $247,131 | $57,785 | $189,346 |
| 2018 | $6,545 | $228,854 | $43,960 | $184,894 |
| 2017 | $6,272 | $224,733 | $39,620 | $185,113 |
| 2016 | $6,114 | $226,743 | $38,185 | $188,558 |
| 2015 | $6,100 | $225,827 | $36,540 | $189,287 |
| 2014 | $5,911 | $182,432 | $26,250 | $156,182 |
| 2013 | -- | $181,412 | $27,300 | $154,112 |
Source: Public Records
Map
Nearby Homes
- 15245 Callahan Rd
- 15355 Redmond Loop
- 15420 Cherrywood Dr
- Hendrix Edge Plan at Ascente - Silverskye Collection
- Hendrix Plan at Ascente - Silverskye Collection
- Axl Air Plan at Ascente - Silverskye Collection
- Royce Elite Plan at Ascente - Copper Rock Collection
- Axl Max Plan at Ascente - Silverskye Collection
- Axl Edge Plan at Ascente - Silverskye Collection
- Brunello Plan at Ascente - Copper Rock Collection
- Axl Plan at Ascente - Silverskye Collection
- Hendrix Max Plan at Ascente - Silverskye Collection
- Hendrix Air Plan at Ascente - Silverskye Collection
- Royce Plan at Ascente - Copper Rock Collection
- Brunello Elite Plan at Ascente - Copper Rock Collection
- 5375 Mountain Creek Ct
- 11026 Copper Rock Trail Unit Homesite 56
- 11026 Copper Rock Trail
- 5220 Shawna Ln
- 6360 de Chardin Ln
- 15180 Chateau Ave
- 15240 Callahan Rd
- 5385 Tannerwood Dr Unit 1
- 5405 Tannerwood Dr
- 5380 Menagerie Ave
- 5365 Tannerwood Dr
- 5385 Menagerie Ave
- 5345 Tannerwood Dr
- 15140 Chateau Ave
- 5380 Tannerwood Dr
- 5405 Menagerie Ave
- 5400 Menagerie Ave
- 5400 Tannerwood Dr
- 5425 Tannerwood Dr
- 5360 Gascony Ct
- 5360 Tannerwood Dr
- 5380 La Briana Ct
- 5380 Gascony Ct
- 5325 Tannerwood Dr
- 5340 Tannerwood Dr