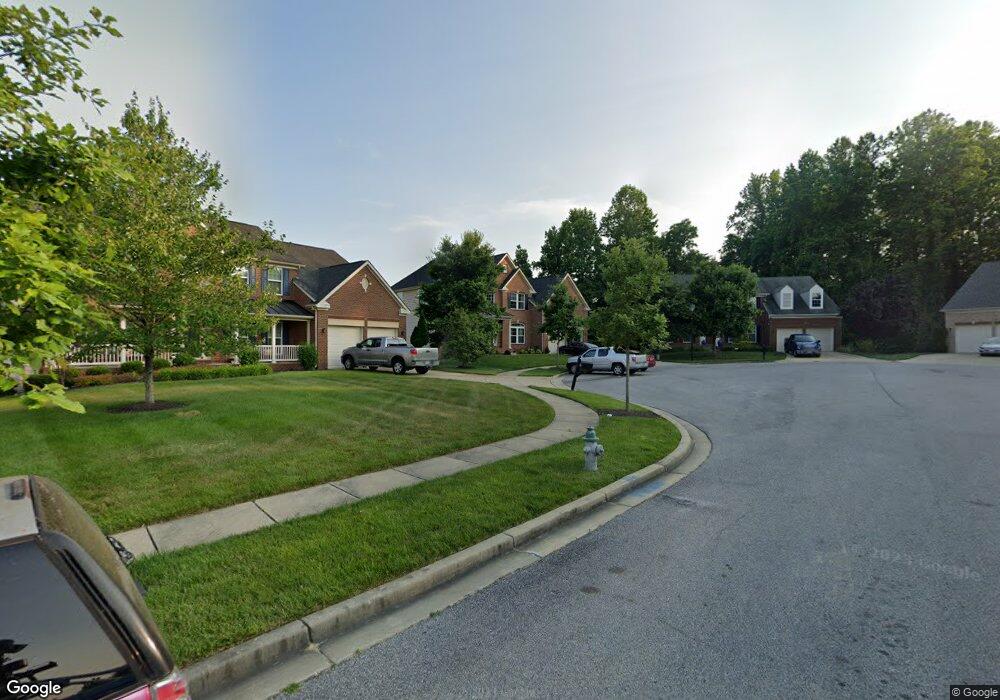
15203 Orchard Farm Place Upper Marlboro, MD 20774
Estimated Value: $791,000 - $871,000
--
Bed
1
Bath
3,579
Sq Ft
$229/Sq Ft
Est. Value
About This Home
This home is located at 15203 Orchard Farm Place, Upper Marlboro, MD 20774 and is currently estimated at $818,753, approximately $228 per square foot. 15203 Orchard Farm Place is a home located in Prince George's County with nearby schools including Patuxent Elementary School, James Madison Middle School, and Dr. Henry A. Wise Jr. High School.
Ownership History
Date
Name
Owned For
Owner Type
Purchase Details
Closed on
Aug 17, 2021
Sold by
Kerr Dwayne A
Bought by
Kerr Dwayne A and Kerr Carlotta
Current Estimated Value
Home Financials for this Owner
Home Financials are based on the most recent Mortgage that was taken out on this home.
Original Mortgage
$557,590
Outstanding Balance
$506,258
Interest Rate
2.8%
Mortgage Type
FHA
Estimated Equity
$312,495
Purchase Details
Closed on
Feb 22, 2013
Sold by
Nvr Inc
Bought by
Kerr Dwayne A
Home Financials for this Owner
Home Financials are based on the most recent Mortgage that was taken out on this home.
Original Mortgage
$510,965
Interest Rate
3.45%
Mortgage Type
New Conventional
Purchase Details
Closed on
Nov 7, 2012
Sold by
V O B Limited Partnership
Bought by
Nvr Inc
Create a Home Valuation Report for This Property
The Home Valuation Report is an in-depth analysis detailing your home's value as well as a comparison with similar homes in the area
Home Values in the Area
Average Home Value in this Area
Purchase History
| Date | Buyer | Sale Price | Title Company |
|---|---|---|---|
| Kerr Dwayne A | -- | Accommodation | |
| Kerr Dwayne A | $510,965 | Stewart Title Guaranty Co | |
| Nvr Inc | $65,000 | None Available |
Source: Public Records
Mortgage History
| Date | Status | Borrower | Loan Amount |
|---|---|---|---|
| Open | Kerr Dwayne A | $557,590 | |
| Closed | Kerr Dwayne A | $510,965 |
Source: Public Records
Tax History Compared to Growth
Tax History
| Year | Tax Paid | Tax Assessment Tax Assessment Total Assessment is a certain percentage of the fair market value that is determined by local assessors to be the total taxable value of land and additions on the property. | Land | Improvement |
|---|---|---|---|---|
| 2025 | $9,119 | $699,500 | $211,300 | $488,200 |
| 2024 | $9,119 | $649,267 | $0 | $0 |
| 2023 | $8,712 | $599,033 | $0 | $0 |
| 2022 | $8,210 | $548,800 | $126,300 | $422,500 |
| 2021 | $7,881 | $531,567 | $0 | $0 |
| 2020 | $7,749 | $514,333 | $0 | $0 |
| 2019 | $7,570 | $497,100 | $100,600 | $396,500 |
| 2018 | $7,382 | $486,967 | $0 | $0 |
| 2017 | $7,243 | $476,833 | $0 | $0 |
| 2016 | -- | $466,700 | $0 | $0 |
| 2015 | -- | $448,267 | $0 | $0 |
| 2014 | -- | $429,833 | $0 | $0 |
Source: Public Records
Map
Nearby Homes
- 2100 Fittleworth Terrace
- 2135 Congresbury Place
- 15304 Camberley Place
- 15219 N Berwick Ln
- 2010 Dornoch Way
- 15305 Torcross Way
- 2403 Lake Forest Dr
- 2424 Newmoor Way
- 15517 Glastonbury Way
- 2704 Beech Orchard Ln
- 15625 Copper Beech Dr
- 15303 Glastonbury Way
- 15503 Humberside Way
- 14707 Goldcrest Foxglove Dr Unit LO34
- 14402 Medwick Rd
- 15608 Bibury Alley
- 14612 Goldcrest Foxglove Dr Unit LO-24
- 15606 Beech Tree Pkwy
- 14604 Goldcrest Foxglove Dr Unit LO-21
- Lehigh Plan at Leeland - Single Family Homes
- 15205 Orchard Farm Place
- 15201 Orchard Farm Place
- 2107 Lake Forest Dr
- 2105 Lake Forest Dr
- 15200 Orchard Farm Place
- 15207 Orchard Farm Place
- 2109 Lake Forest Dr
- 2103 Lake Forest Dr
- 15204 Orchard Farm Place
- 15202 Orchard Farm Place
- 15209 Orchard Farm Place
- 15206 Orchard Farm Place
- 2003 Turleygreen Place
- 2111 Lake Forest Dr
- 15208 Lincolnshire Place
- 2108 Lake Forest Dr
- 2104 Lake Forest Dr
- 15206 Lincolnshire Place
- 1917 Turleygreen Place