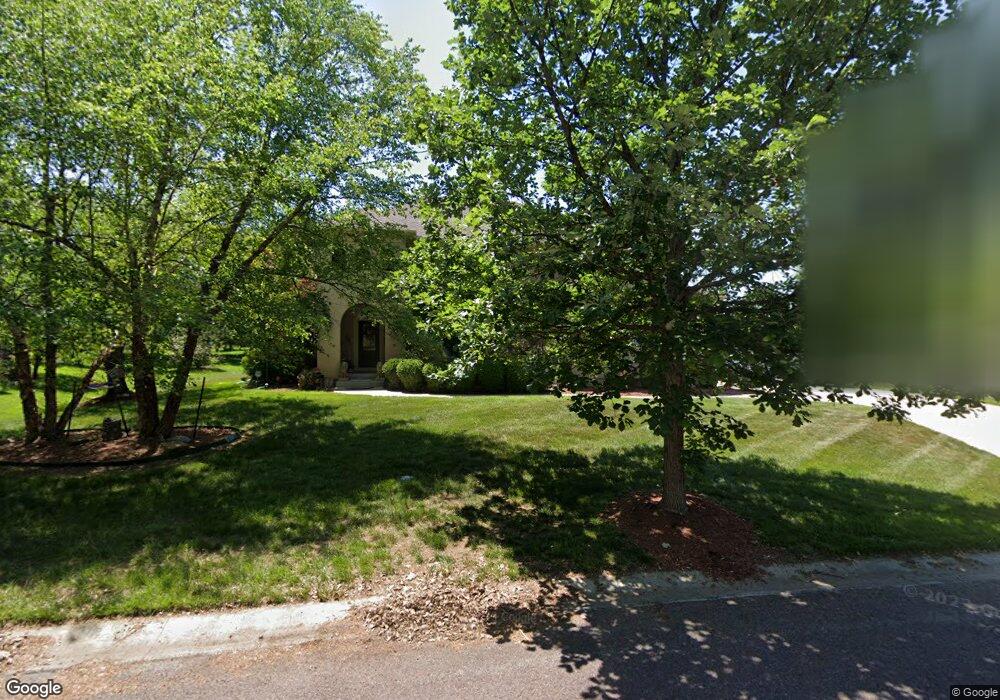
15204 Perry St Overland Park, KS 66221
South Overland Park NeighborhoodEstimated Value: $928,000 - $1,068,000
4
Beds
5
Baths
4,115
Sq Ft
$243/Sq Ft
Est. Value
About This Home
This home is located at 15204 Perry St, Overland Park, KS 66221 and is currently estimated at $1,001,542, approximately $243 per square foot. 15204 Perry St is a home located in Johnson County with nearby schools including Timber Creek Elementary School, Aubry Bend Middle School, and Blue Valley Southwest High School.
Ownership History
Date
Name
Owned For
Owner Type
Purchase Details
Closed on
Jul 11, 2025
Sold by
Albert C Fox Trust and Fox Albert C
Bought by
Albert C Fox Trust and Fox
Current Estimated Value
Home Financials for this Owner
Home Financials are based on the most recent Mortgage that was taken out on this home.
Original Mortgage
$312,372
Outstanding Balance
$311,843
Interest Rate
6.85%
Mortgage Type
FHA
Estimated Equity
$689,699
Purchase Details
Closed on
Apr 24, 2007
Sold by
United Engineers Inc
Bought by
Fox Albert C and Albert C Fox Trust
Home Financials for this Owner
Home Financials are based on the most recent Mortgage that was taken out on this home.
Original Mortgage
$299,950
Interest Rate
5.84%
Mortgage Type
Adjustable Rate Mortgage/ARM
Purchase Details
Closed on
Feb 3, 2006
Sold by
Colton Lake Llc
Bought by
United Engineers Inc
Create a Home Valuation Report for This Property
The Home Valuation Report is an in-depth analysis detailing your home's value as well as a comparison with similar homes in the area
Home Values in the Area
Average Home Value in this Area
Purchase History
| Date | Buyer | Sale Price | Title Company |
|---|---|---|---|
| Albert C Fox Trust | -- | None Listed On Document | |
| Albert C Fox Trust | -- | None Listed On Document | |
| Fox Albert C | -- | First American Title Ins Co | |
| United Engineers Inc | -- | First American Title Insuran |
Source: Public Records
Mortgage History
| Date | Status | Borrower | Loan Amount |
|---|---|---|---|
| Open | Albert C Fox Trust | $312,372 | |
| Closed | Albert C Fox Trust | $312,372 | |
| Previous Owner | Fox Albert C | $299,950 |
Source: Public Records
Tax History Compared to Growth
Tax History
| Year | Tax Paid | Tax Assessment Tax Assessment Total Assessment is a certain percentage of the fair market value that is determined by local assessors to be the total taxable value of land and additions on the property. | Land | Improvement |
|---|---|---|---|---|
| 2024 | $10,626 | $102,706 | $20,640 | $82,066 |
| 2023 | $10,310 | $98,532 | $20,640 | $77,892 |
| 2022 | $9,239 | $86,744 | $20,640 | $66,104 |
| 2021 | $9,183 | $82,122 | $18,443 | $63,679 |
| 2020 | $9,176 | $81,489 | $16,028 | $65,461 |
| 2019 | $9,038 | $78,568 | $13,935 | $64,633 |
| 2018 | $9,202 | $78,396 | $16,649 | $61,747 |
| 2017 | $9,059 | $75,797 | $16,649 | $59,148 |
| 2016 | $8,666 | $72,450 | $16,649 | $55,801 |
| 2015 | $8,708 | $72,450 | $16,649 | $55,801 |
| 2013 | -- | $68,977 | $16,649 | $52,328 |
Source: Public Records
Map
Nearby Homes
- 15225 Perry St
- 10311 W 151st Terrace
- Westminster Plan at Villas of Avalon
- Coventry Plan at Villas of Avalon
- Camelot Plan at Villas of Avalon
- 10303 W 151st Terrace
- 9801 W 152nd St
- 10125 W 149th Terrace
- 9519 W 151st Terrace
- 14808 Carter St
- 14923 Melrose St
- 14605 Carter St
- 14602 Grant Ln
- 15533 England St
- 9016 W 148th Terrace
- 9311 W 155th Ct
- 9013 W 148th St
- The Breckenridge Plan at Polo Fields
- The Laguna Plan at Polo Fields
- The Laguna 1.5 Story Plan at Polo Fields
- 15200 Perry St
- 15208 Perry St
- 15212 Perry St
- 15201 Perry St
- 15120 Perry St
- 15205 Perry St
- 15161 Switzer Rd
- 15121 Perry St
- 15217 Perry St
- 10119 W 152nd Terrace
- 15141 Switzer Rd
- 15116 Perry St
- 15117 Perry St
- 15221 Perry St
- 15112 Perry St
- 15220 Perry St
- 15255 Switzer Rd
- 15115 Switzer Rd
- 10301 W 151st Place
- 10305 W 151st Place