Estimated Value: $326,000 - $372,000
--
Bed
--
Bath
1,456
Sq Ft
$237/Sq Ft
Est. Value
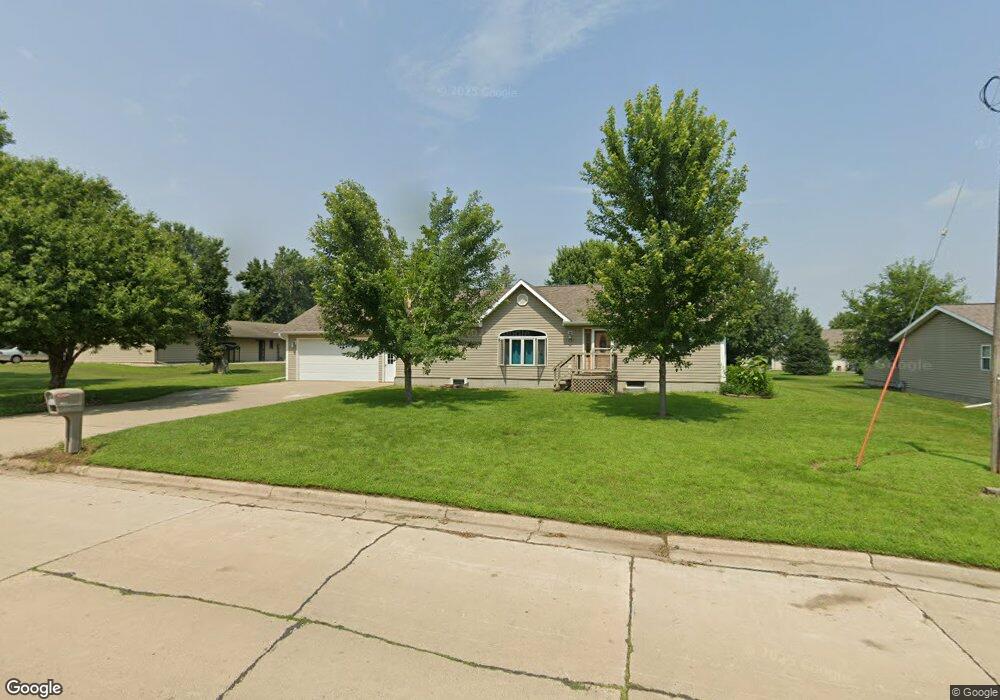
About This Home
This home is located at 1521 3rd St, Hull, IA 51239 and is currently estimated at $344,533, approximately $236 per square foot. 1521 3rd St is a home located in Sioux County with nearby schools including Boyden-Hull Elementary School, Boyden-Hull High School, and Hull Christian School.
Ownership History
Date
Name
Owned For
Owner Type
Purchase Details
Closed on
Sep 23, 2025
Sold by
Vanmiddendorp Brett Alan
Bought by
Rose Vanmiddendorp Kaleigh
Current Estimated Value
Purchase Details
Closed on
Feb 9, 2023
Sold by
Vanmiddendorp Brett and Vanmiddendorp Kaleigh
Bought by
Vanmiddendorp Brett and Vanmiddendorp Van Middendorp
Purchase Details
Closed on
Jun 10, 2014
Sold by
Driesen Kevin and Driesen Janice
Bought by
Vanmiddendorp Brett A
Home Financials for this Owner
Home Financials are based on the most recent Mortgage that was taken out on this home.
Original Mortgage
$132,800
Interest Rate
4.13%
Mortgage Type
New Conventional
Create a Home Valuation Report for This Property
The Home Valuation Report is an in-depth analysis detailing your home's value as well as a comparison with similar homes in the area
Home Values in the Area
Average Home Value in this Area
Purchase History
| Date | Buyer | Sale Price | Title Company |
|---|---|---|---|
| Rose Vanmiddendorp Kaleigh | -- | None Listed On Document | |
| Vanmiddendorp Brett | -- | -- | |
| Vanmiddendorp Brett A | $166,000 | None Available |
Source: Public Records
Mortgage History
| Date | Status | Borrower | Loan Amount |
|---|---|---|---|
| Previous Owner | Vanmiddendorp Brett A | $132,800 |
Source: Public Records
Tax History Compared to Growth
Tax History
| Year | Tax Paid | Tax Assessment Tax Assessment Total Assessment is a certain percentage of the fair market value that is determined by local assessors to be the total taxable value of land and additions on the property. | Land | Improvement |
|---|---|---|---|---|
| 2025 | $4,180 | $339,370 | $32,440 | $306,930 |
| 2024 | $4,180 | $285,610 | $32,440 | $253,170 |
| 2023 | $4,118 | $285,610 | $32,440 | $253,170 |
| 2022 | $4,054 | $244,360 | $32,440 | $211,920 |
| 2021 | $3,858 | $243,640 | $32,440 | $211,200 |
| 2020 | $3,858 | $221,020 | $32,440 | $188,580 |
| 2019 | $3,640 | $206,380 | $13,520 | $192,860 |
| 2018 | $3,712 | $206,380 | $13,520 | $192,860 |
| 2017 | $3,712 | $206,380 | $13,520 | $192,860 |
| 2014 | $3,042 | $172,440 | $0 | $0 |
Source: Public Records
Map
Nearby Homes
- 1607 3rd St
- 1515 3rd St
- 1519 Willow St
- 1609 Willow St
- 1613 3rd St
- 1524 3rd St
- 1518 3rd St
- 1606 3rd St
- 1615 Willow St
- 1510 3rd St
- 1711 3rd St Unit 10
- 1711 3rd St Unit 9
- 1711 3rd St Unit 8
- 1711 3rd St Unit 7
- 1711 3rd St Unit 6
- 1711 3rd St Unit 5
- 1711 3rd St Unit 4
- 1711 3rd St Unit 2
- 1711 3rd St Unit 1
- 1502 3rd St