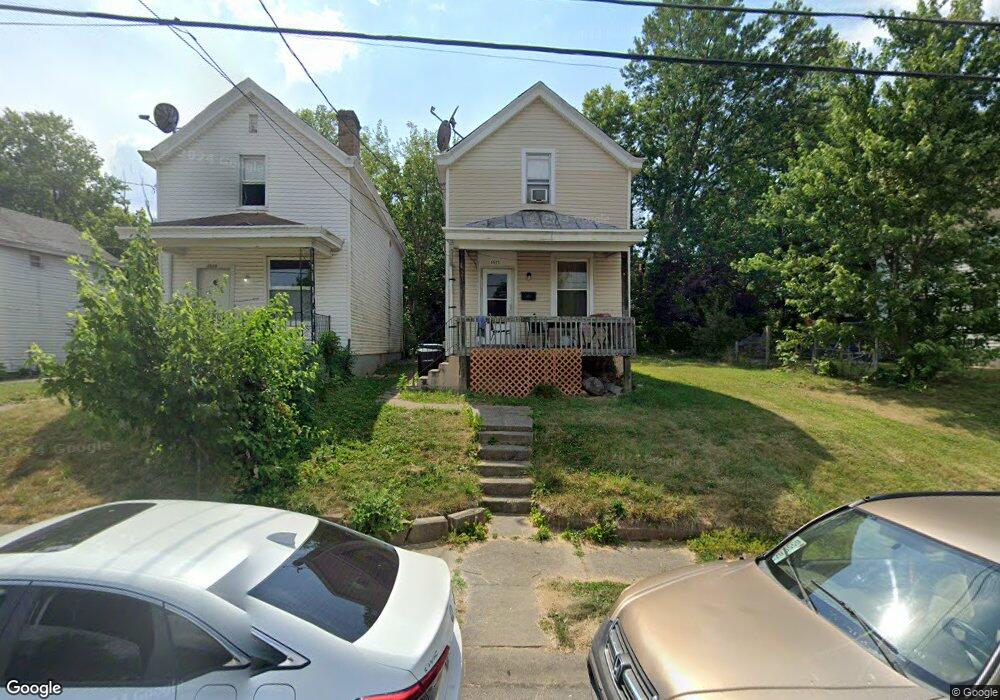
1521 Beech Ave Cincinnati, OH 45205
West Price Hill NeighborhoodEstimated Value: $126,000 - $143,000
3
Beds
2
Baths
1,280
Sq Ft
$102/Sq Ft
Est. Value
About This Home
This home is located at 1521 Beech Ave, Cincinnati, OH 45205 and is currently estimated at $130,743, approximately $102 per square foot. 1521 Beech Ave is a home located in Hamilton County with nearby schools including Carson School, Gilbert A. Dater High School, and Western Hills High School.
Ownership History
Date
Name
Owned For
Owner Type
Purchase Details
Closed on
Jun 16, 2009
Sold by
Smith Karen
Bought by
Thiama Abdoul
Current Estimated Value
Purchase Details
Closed on
May 14, 2009
Sold by
Luo Pengling
Bought by
Smith Karen
Purchase Details
Closed on
Aug 8, 2006
Sold by
Renew Real Estate Ventures Llc
Bought by
Luo Pengling
Home Financials for this Owner
Home Financials are based on the most recent Mortgage that was taken out on this home.
Original Mortgage
$10,600
Interest Rate
6.78%
Mortgage Type
Credit Line Revolving
Purchase Details
Closed on
Mar 20, 2006
Sold by
American General Financial Services Inc
Bought by
Renew Real Estate Venture Llc
Purchase Details
Closed on
Jun 23, 2005
Sold by
Darling Roxie G
Bought by
American General Financial Services Inc
Purchase Details
Closed on
Jan 26, 1998
Sold by
Pepples Roger L and Pepples Robin J
Bought by
Darling Roxie G
Create a Home Valuation Report for This Property
The Home Valuation Report is an in-depth analysis detailing your home's value as well as a comparison with similar homes in the area
Home Values in the Area
Average Home Value in this Area
Purchase History
| Date | Buyer | Sale Price | Title Company |
|---|---|---|---|
| Thiama Abdoul | $10,000 | Stewart Title Guaranty Co | |
| Smith Karen | -- | None Available | |
| Luo Pengling | $66,300 | None Available | |
| Renew Real Estate Venture Llc | $20,000 | None Available | |
| American General Financial Services Inc | -- | None Available | |
| Darling Roxie G | $49,900 | -- |
Source: Public Records
Mortgage History
| Date | Status | Borrower | Loan Amount |
|---|---|---|---|
| Previous Owner | Luo Pengling | $10,600 |
Source: Public Records
Tax History
| Year | Tax Paid | Tax Assessment Tax Assessment Total Assessment is a certain percentage of the fair market value that is determined by local assessors to be the total taxable value of land and additions on the property. | Land | Improvement |
|---|---|---|---|---|
| 2025 | $1,475 | $23,860 | $2,468 | $21,392 |
| 2023 | $1,462 | $23,860 | $2,468 | $21,392 |
| 2022 | $728 | $10,602 | $2,454 | $8,148 |
| 2021 | $699 | $10,602 | $2,454 | $8,148 |
| 2020 | $720 | $10,602 | $2,454 | $8,148 |
| 2019 | $715 | $9,636 | $2,230 | $7,406 |
| 2018 | $716 | $9,636 | $2,230 | $7,406 |
| 2017 | $680 | $9,636 | $2,230 | $7,406 |
| 2016 | $224 | $3,081 | $2,384 | $697 |
| 2015 | $202 | $3,081 | $2,384 | $697 |
| 2014 | $203 | $3,081 | $2,384 | $697 |
| 2013 | $234 | $3,500 | $2,709 | $791 |
Source: Public Records
Map
Nearby Homes
- 1440 Manss Ave
- 4000 Akochia Ave
- 1705 Wyoming Ave
- 1710 Wyoming Ave
- 1318 Beech Ave
- 1613 Wyoming Ave
- 2024 Sunset Ave
- 1634 Dewey Ave
- 1647 Dewey Ave
- 1812 Quebec Rd
- 4033 W Liberty St
- 3744 Mayfield Ave
- 3742 Mayfield Ave
- 1222 Dewey Ave
- 2403 Glenway Ave
- 2245 Quebec Rd
- 2084 Queen City Ave
- 1113 Gilsey Ave
- 1110 Winfield Ave
- 1226 Rutledge Ave
Your Personal Tour Guide
Ask me questions while you tour the home.