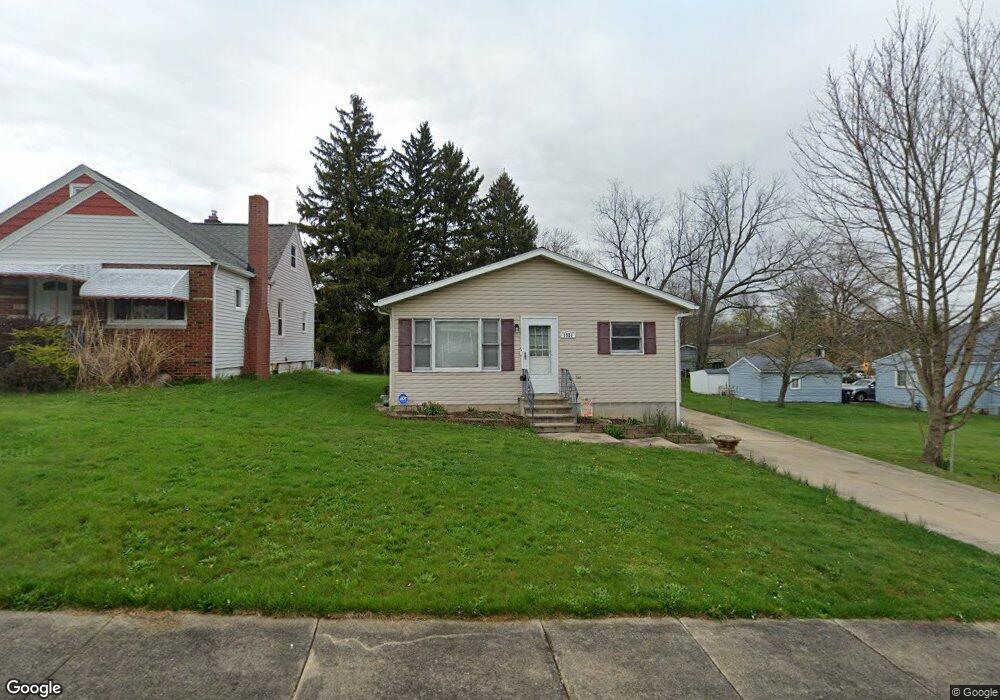
1521 Bronson Rd Akron, OH 44305
Goodyear Heights NeighborhoodEstimated Value: $150,000 - $206,000
3
Beds
2
Baths
1,092
Sq Ft
$164/Sq Ft
Est. Value
About This Home
This home is located at 1521 Bronson Rd, Akron, OH 44305 and is currently estimated at $178,786, approximately $163 per square foot. 1521 Bronson Rd is a home located in Summit County with nearby schools including Seiberling Community Learning Center, Middlebury Academy, and Case Preparatory Academy.
Ownership History
Date
Name
Owned For
Owner Type
Purchase Details
Closed on
May 23, 2018
Sold by
Lancaster John R and Lancaster Michael S
Bought by
Lancaster Ryan
Current Estimated Value
Home Financials for this Owner
Home Financials are based on the most recent Mortgage that was taken out on this home.
Original Mortgage
$74,205
Outstanding Balance
$63,480
Interest Rate
4.4%
Mortgage Type
New Conventional
Estimated Equity
$115,307
Purchase Details
Closed on
Dec 30, 2009
Sold by
Hawkins Tracy A and Hawkins Gordon F
Bought by
Lancaster John R and Lancaster Michael S
Home Financials for this Owner
Home Financials are based on the most recent Mortgage that was taken out on this home.
Original Mortgage
$81,496
Interest Rate
5.5%
Mortgage Type
FHA
Purchase Details
Closed on
Jun 22, 2001
Sold by
Ardmore Foundation Inc
Bought by
Mclean Tracy A
Home Financials for this Owner
Home Financials are based on the most recent Mortgage that was taken out on this home.
Original Mortgage
$84,245
Interest Rate
7.27%
Mortgage Type
FHA
Create a Home Valuation Report for This Property
The Home Valuation Report is an in-depth analysis detailing your home's value as well as a comparison with similar homes in the area
Home Values in the Area
Average Home Value in this Area
Purchase History
| Date | Buyer | Sale Price | Title Company |
|---|---|---|---|
| Lancaster Ryan | $76,500 | Quest Title Agency Inc | |
| Lancaster John R | $83,000 | Abby Title | |
| Mclean Tracy A | $90,000 | Insignia |
Source: Public Records
Mortgage History
| Date | Status | Borrower | Loan Amount |
|---|---|---|---|
| Open | Lancaster Ryan | $74,205 | |
| Previous Owner | Lancaster John R | $81,496 | |
| Previous Owner | Mclean Tracy A | $84,245 |
Source: Public Records
Tax History
| Year | Tax Paid | Tax Assessment Tax Assessment Total Assessment is a certain percentage of the fair market value that is determined by local assessors to be the total taxable value of land and additions on the property. | Land | Improvement |
|---|---|---|---|---|
| 2025 | $2,855 | $54,212 | $11,907 | $42,305 |
| 2024 | $2,855 | $54,212 | $11,907 | $42,305 |
| 2023 | $2,855 | $54,212 | $11,907 | $42,305 |
| 2022 | $2,286 | $33,866 | $7,350 | $26,516 |
| 2021 | $2,289 | $33,866 | $7,350 | $26,516 |
| 2020 | $2,254 | $33,870 | $7,350 | $26,520 |
| 2019 | $2,067 | $28,140 | $7,280 | $20,860 |
| 2018 | $2,039 | $28,140 | $7,280 | $20,860 |
| 2017 | $2,230 | $28,140 | $7,280 | $20,860 |
| 2016 | $2,231 | $30,380 | $7,280 | $23,100 |
| 2015 | $2,230 | $30,380 | $7,280 | $23,100 |
| 2014 | $2,212 | $30,380 | $7,280 | $23,100 |
| 2013 | $2,304 | $32,390 | $7,280 | $25,110 |
Source: Public Records
Map
Nearby Homes
- 2211 Goodyear Blvd
- 856 Morningview Ave
- 1585 Norledge Rd
- 821 Cree Ave
- 810 Mohawk Ave
- 1605 Multnoma Ave
- 718 Eastland Ave
- 420 Tammery Dr
- 1183 Eastland Ave
- 1337 Leonora Ave
- 1331 Leonora Ave
- 1265 Eastwood Ave
- 1725 Olalla Ave
- 942 Caddo Ave
- 586 Lindell St
- 625 Wyandot Ave
- 600 Eastland Ave
- 561 Melrose St
- 1364 Arnold Ave
- 784 Shoshone Ave
- 1515 Bronson Rd
- 1509 Bronson Rd
- 2221 Goodyear Blvd
- 2227 Goodyear Blvd
- 2237 Goodyear Blvd
- 1505 Bronson Rd
- 939 Eastland Ave
- 931 Eastland Ave
- 2255 Goodyear Blvd
- 1520 Bronson Rd
- 923 Eastland Ave
- 1516 Bronson Rd
- 1510 Bronson Rd
- 2207 Goodyear Blvd
- 1504 Bronson Rd
- 951 Eastland Ave
- 1501 Bronson Rd
- 2232 Goodyear Blvd
- 2201 Goodyear Blvd
- 955 Eastland Ave
Your Personal Tour Guide
Ask me questions while you tour the home.