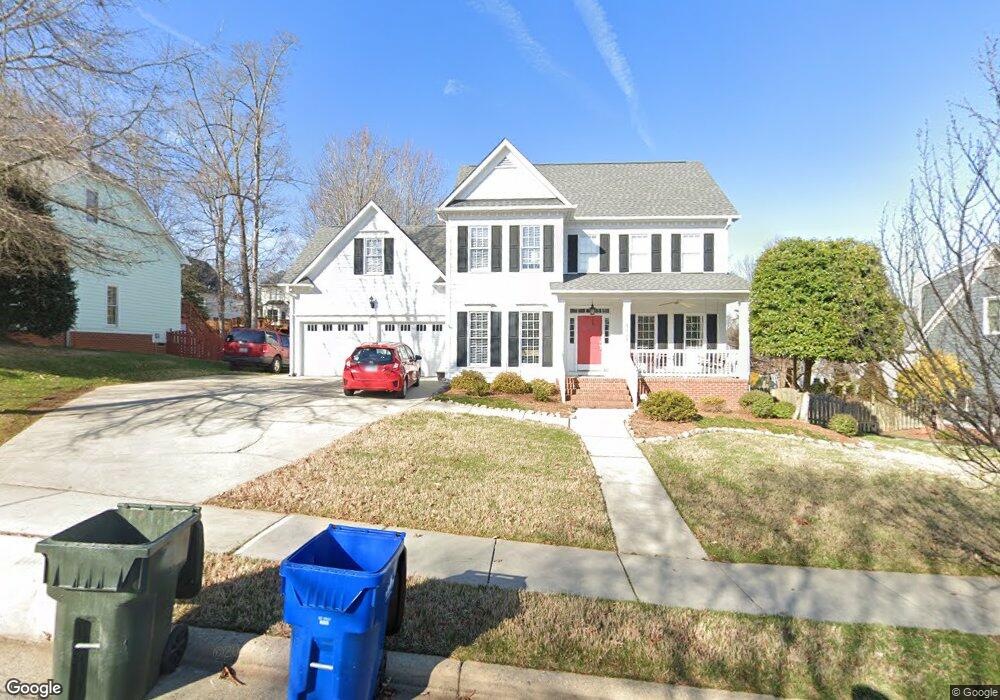
1521 Cooper Falls Ln Raleigh, NC 27614
Estimated Value: $581,000 - $618,000
4
Beds
3
Baths
2,382
Sq Ft
$251/Sq Ft
Est. Value
About This Home
This home is located at 1521 Cooper Falls Ln, Raleigh, NC 27614 and is currently estimated at $597,461, approximately $250 per square foot. 1521 Cooper Falls Ln is a home located in Wake County with nearby schools including Abbotts Creek Elementary School, East Millbrook Middle, and Millbrook High School.
Ownership History
Date
Name
Owned For
Owner Type
Purchase Details
Closed on
Aug 16, 2025
Sold by
Hewett Frederick Allen and Hewett Cathryn Lentz
Bought by
Lentz Hewett Cathryn
Current Estimated Value
Purchase Details
Closed on
May 8, 2002
Sold by
Snyder James E and Snyder Mary M
Bought by
Hewett Ii Frederick Allen and Hewett Cathryn Lentz
Home Financials for this Owner
Home Financials are based on the most recent Mortgage that was taken out on this home.
Original Mortgage
$255,000
Interest Rate
6.62%
Purchase Details
Closed on
Apr 29, 1998
Sold by
Robuck Homes Partnership
Bought by
Snyder James E and Snyder Mary M
Home Financials for this Owner
Home Financials are based on the most recent Mortgage that was taken out on this home.
Original Mortgage
$195,600
Interest Rate
7.03%
Create a Home Valuation Report for This Property
The Home Valuation Report is an in-depth analysis detailing your home's value as well as a comparison with similar homes in the area
Home Values in the Area
Average Home Value in this Area
Purchase History
| Date | Buyer | Sale Price | Title Company |
|---|---|---|---|
| Lentz Hewett Cathryn | -- | None Listed On Document | |
| Hewett Ii Frederick Allen | $255,000 | -- | |
| Snyder James E | $244,500 | -- |
Source: Public Records
Mortgage History
| Date | Status | Borrower | Loan Amount |
|---|---|---|---|
| Previous Owner | Hewett Ii Frederick Allen | $255,000 | |
| Previous Owner | Snyder James E | $195,600 |
Source: Public Records
Tax History Compared to Growth
Tax History
| Year | Tax Paid | Tax Assessment Tax Assessment Total Assessment is a certain percentage of the fair market value that is determined by local assessors to be the total taxable value of land and additions on the property. | Land | Improvement |
|---|---|---|---|---|
| 2025 | -- | $541,517 | $135,000 | $406,517 |
| 2024 | $4,723 | $541,517 | $135,000 | $406,517 |
| 2023 | $3,895 | $355,500 | $91,000 | $264,500 |
| 2022 | $3,619 | $355,500 | $91,000 | $264,500 |
| 2021 | $3,479 | $355,500 | $91,000 | $264,500 |
| 2020 | $3,416 | $355,500 | $91,000 | $264,500 |
| 2019 | $3,621 | $310,682 | $86,000 | $224,682 |
| 2018 | $3,415 | $310,682 | $86,000 | $224,682 |
| 2017 | $3,252 | $310,682 | $86,000 | $224,682 |
| 2016 | $0 | $310,682 | $86,000 | $224,682 |
| 2015 | -- | $313,114 | $86,000 | $227,114 |
| 2014 | -- | $313,114 | $86,000 | $227,114 |
Source: Public Records
Map
Nearby Homes
- 1437 Chelton Oaks Place
- 10205 Sorrills Creek Ln
- 10701 Mandarin Ct
- 1700 Southwell Ct
- 1700 Farmington Grove Dr
- 1741 Farmington Grove Dr
- 1310 Durlain Dr Unit 103
- 1310 Durlain Dr Unit 107
- 1301 Durlain Dr Unit 103
- 10415 Ashmead Ln
- 4720 All Points View Way
- 1505 October Rd
- 1405 October Rd
- 10520 Pleasant Branch Dr Unit Lot 32
- 10506 Pleasant Branch Dr Unit Lot 38
- 10534 Pleasant Branch Dr Unit Lot 30
- 10536 Pleasant Branch Dr Unit Lot 29
- 10542 Pleasant Branch Dr Unit Lot 27
- 10546 Pleasant Branch Dr Unit Lot 25
- 10548 Pleasant Branch Dr Unit Lot 24
- 1517 Cooper Falls Ln
- 10309 Crisp Dr
- 10317 Crisp Dr
- 1513 Cooper Falls Ln
- 1441 Chelton Oaks Place
- 10321 Crisp Dr
- 1605 Cooper Falls Ln
- 10305 Crisp Dr
- 1616 Cooper Falls Ln
- 10325 Crisp Dr
- 1516 Cooper Falls Ln
- 1509 Cooper Falls Ln
- 10301 Crisp Dr
- 10329 Crisp Dr
- 1629 Cooper Falls Ln
- 10300 Crisp Dr
- 1440 Chelton Oaks Place
- 1512 Cooper Falls Ln
- 1505 Cooper Falls Ln
- 1609 Cooper Falls Ln