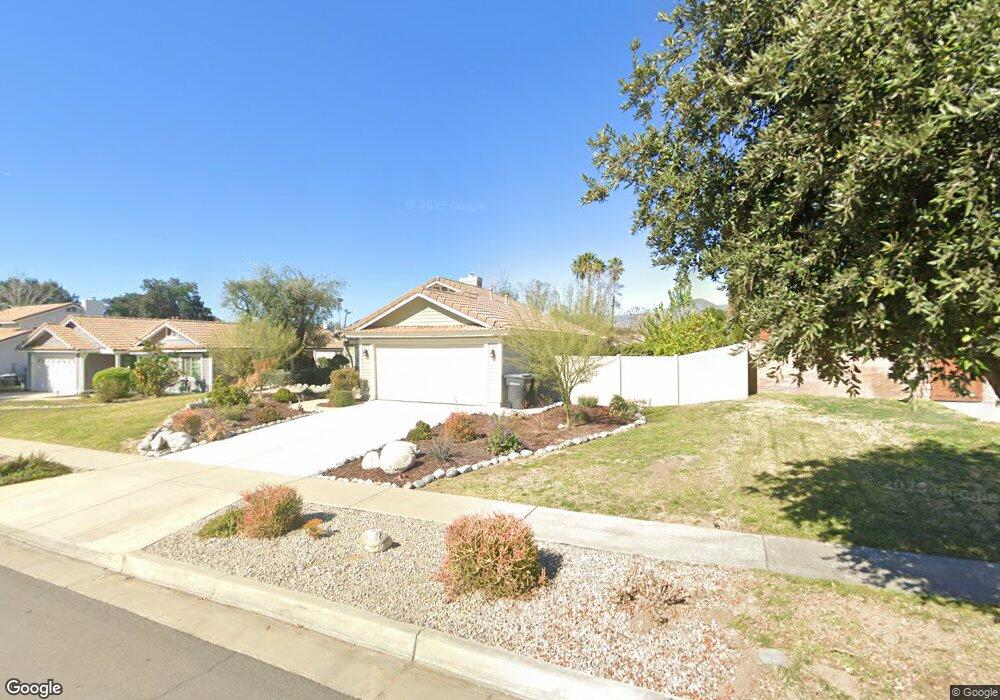
1521 Emilia Way Redlands, CA 92374
North Redlands NeighborhoodEstimated Value: $529,361 - $595,000
2
Beds
2
Baths
1,034
Sq Ft
$543/Sq Ft
Est. Value
About This Home
This home is located at 1521 Emilia Way, Redlands, CA 92374 and is currently estimated at $561,340, approximately $542 per square foot. 1521 Emilia Way is a home located in San Bernardino County with nearby schools including Judson & Brown Elementary School, Clement Middle School, and Redlands East Valley High School.
Ownership History
Date
Name
Owned For
Owner Type
Purchase Details
Closed on
Jun 22, 2020
Sold by
Shen Rae Kate
Bought by
Shen Rae Kate and Rae Kate Shen Trust
Current Estimated Value
Purchase Details
Closed on
Oct 17, 1995
Sold by
Shen Billy Y G
Bought by
Shen Rae Kate
Purchase Details
Closed on
Aug 16, 1993
Sold by
Shen Helen Y C
Bought by
Shen Billy Y G
Home Financials for this Owner
Home Financials are based on the most recent Mortgage that was taken out on this home.
Original Mortgage
$110,313
Interest Rate
7.21%
Mortgage Type
FHA
Purchase Details
Closed on
Aug 10, 1993
Sold by
Harrow Margaret and Diez Margaret Ann
Bought by
Shen Rae Kate and Shen Billy Y G
Home Financials for this Owner
Home Financials are based on the most recent Mortgage that was taken out on this home.
Original Mortgage
$110,313
Interest Rate
7.21%
Mortgage Type
FHA
Create a Home Valuation Report for This Property
The Home Valuation Report is an in-depth analysis detailing your home's value as well as a comparison with similar homes in the area
Home Values in the Area
Average Home Value in this Area
Purchase History
| Date | Buyer | Sale Price | Title Company |
|---|---|---|---|
| Shen Rae Kate | -- | None Available | |
| Shen Rae Kate | -- | -- | |
| Shen Billy Y G | -- | Gateway Title Company | |
| Shen Rae Kate | $126,000 | Gateway Title Company | |
| Harrow Margaret | -- | Gateway Title Company |
Source: Public Records
Mortgage History
| Date | Status | Borrower | Loan Amount |
|---|---|---|---|
| Closed | Shen Rae Kate | $110,313 |
Source: Public Records
Tax History Compared to Growth
Tax History
| Year | Tax Paid | Tax Assessment Tax Assessment Total Assessment is a certain percentage of the fair market value that is determined by local assessors to be the total taxable value of land and additions on the property. | Land | Improvement |
|---|---|---|---|---|
| 2025 | $2,068 | $182,736 | $49,837 | $132,899 |
| 2024 | $2,068 | $179,153 | $48,860 | $130,293 |
| 2023 | $2,064 | $175,640 | $47,902 | $127,738 |
| 2022 | $2,033 | $172,196 | $46,963 | $125,233 |
| 2021 | $2,068 | $168,819 | $46,042 | $122,777 |
| 2020 | $2,036 | $167,088 | $45,570 | $121,518 |
| 2019 | $1,978 | $163,811 | $44,676 | $119,135 |
| 2018 | $1,928 | $160,599 | $43,800 | $116,799 |
| 2017 | $1,910 | $157,450 | $42,941 | $114,509 |
| 2016 | $1,887 | $154,363 | $42,099 | $112,264 |
| 2015 | $1,872 | $152,045 | $41,467 | $110,578 |
| 2014 | $1,837 | $149,067 | $40,655 | $108,412 |
Source: Public Records
Map
Nearby Homes
- 1529 Cambridge Ave
- 1573 E Brockton Ave
- 1461 Paloma Ave
- 1219 Placer St
- 907 Knightsbridge Ln
- 1639 E Brockton Ave
- 941 Kensington Dr
- 1141 Via Antibes
- 1231 Via Antibes
- 1578 Silver Cup Ct
- 1171 Judson St
- 1683 E Brockton Ave
- 1107 Via San Remo
- 1226 Via Palermo
- 1721 E Colton Ave Unit 38
- 1721 E Colton Ave Unit 119
- 1721 E Colton Ave Unit 89
- 1721 E Colton Ave Unit 103
- 1721 E Colton Ave Unit 106
- 1721 E Colton Ave Unit 82
- 1517 Emilia Way
- 1525 Emilia Way
- 1520 Padua Ave
- 1524 Padua Ave
- 1516 Padua Ave
- 1513 Emilia Way
- 1529 Emilia Way
- 1522 Emilia Way
- 1526 Emilia Way
- 1518 Emilia Way
- 1528 Padua Ave
- 1512 Padua Ave
- 1533 Emilia Way
- 1530 Emilia Way
- 1514 Emilia Way
- 1537 Emilia Way
- 1203 Darlene Ct
- 1532 Padua Ave
- 1527 E Brockton Ave
- 1531 E Brockton Ave