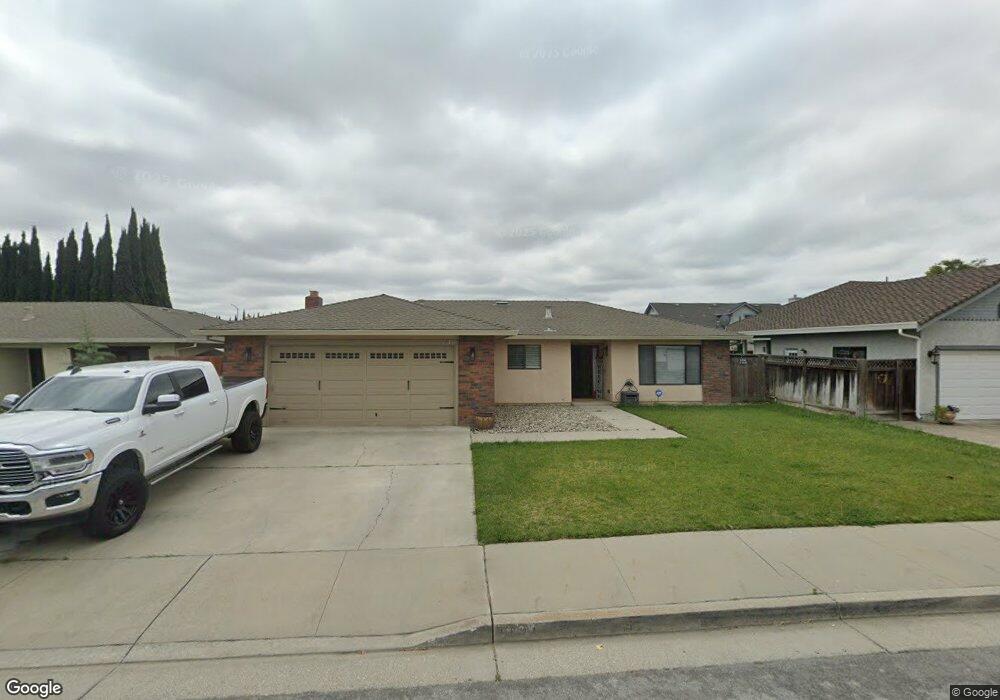
1521 Ghione Dr Hollister, CA 95023
Estimated Value: $663,000 - $714,319
3
Beds
2
Baths
1,573
Sq Ft
$443/Sq Ft
Est. Value
About This Home
This home is located at 1521 Ghione Dr, Hollister, CA 95023 and is currently estimated at $697,330, approximately $443 per square foot. 1521 Ghione Dr is a home located in San Benito County with nearby schools including Cerra Vista Elementary School, Rancho San Justo School, and San Benito High School.
Ownership History
Date
Name
Owned For
Owner Type
Purchase Details
Closed on
Dec 23, 2019
Sold by
Burbank Nereyda
Bought by
Garcia Jay
Current Estimated Value
Home Financials for this Owner
Home Financials are based on the most recent Mortgage that was taken out on this home.
Original Mortgage
$461,235
Outstanding Balance
$406,645
Interest Rate
3.6%
Mortgage Type
New Conventional
Estimated Equity
$290,685
Purchase Details
Closed on
Jan 10, 2016
Sold by
Burbank Nereyda and Garcia Nereyda
Bought by
Burbank Nereyda
Purchase Details
Closed on
Jul 13, 2010
Sold by
Domingues Ronald C and Domingues Joan C
Bought by
Garcia Nereyda
Home Financials for this Owner
Home Financials are based on the most recent Mortgage that was taken out on this home.
Original Mortgage
$281,213
Interest Rate
5.12%
Mortgage Type
FHA
Create a Home Valuation Report for This Property
The Home Valuation Report is an in-depth analysis detailing your home's value as well as a comparison with similar homes in the area
Home Values in the Area
Average Home Value in this Area
Purchase History
| Date | Buyer | Sale Price | Title Company |
|---|---|---|---|
| Garcia Jay | $477,500 | Chicago Title Company | |
| Burbank Nereyda | -- | Accommodation | |
| Burbank Nereyda | -- | Accommodation | |
| Garcia Nereyda | $285,000 | First American Title Company |
Source: Public Records
Mortgage History
| Date | Status | Borrower | Loan Amount |
|---|---|---|---|
| Open | Garcia Jay | $461,235 | |
| Previous Owner | Garcia Nereyda | $281,213 |
Source: Public Records
Tax History Compared to Growth
Tax History
| Year | Tax Paid | Tax Assessment Tax Assessment Total Assessment is a certain percentage of the fair market value that is determined by local assessors to be the total taxable value of land and additions on the property. | Land | Improvement |
|---|---|---|---|---|
| 2025 | $6,978 | $574,160 | $235,132 | $339,028 |
| 2023 | $6,978 | $551,866 | $226,002 | $325,864 |
| 2022 | $6,756 | $541,046 | $221,571 | $319,475 |
| 2021 | $6,663 | $530,438 | $217,227 | $313,211 |
| 2020 | $6,691 | $525,000 | $215,000 | $310,000 |
| 2019 | $4,155 | $329,777 | $127,281 | $202,496 |
| 2018 | $4,055 | $323,312 | $124,786 | $198,526 |
| 2017 | $4,001 | $316,974 | $122,340 | $194,634 |
| 2016 | $3,764 | $310,760 | $119,942 | $190,818 |
| 2015 | $3,728 | $306,093 | $118,141 | $187,952 |
| 2014 | $3,507 | $300,098 | $115,827 | $184,271 |
Source: Public Records
Map
Nearby Homes
- 2110 Glenview Dr
- 2102 White Oak Dr
- 2180 Clearview Dr
- 2230 Ventana Ct
- 2260 Ventana Ct
- 1600 Panorama Dr
- 1231 Westward Dr
- 1531 Brighton Dr
- 1871 Amaryllis Dr
- 2111 Marty Ln
- 1671 Monticello Dr
- 2240 Preston Ct
- 1901 Amaryllis Dr
- 1880 Peony St
- 1871 Peony St
- 1890 Peony St
- 1120 Richard Rd
- 2711 Valley View Rd
- 1900 Peony St
- 2171 White Oak Dr