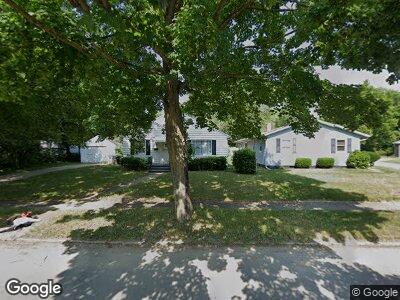
1521 Huey St South Bend, IN 46628
Far Northwest NeighborhoodEstimated Value: $85,000 - $101,000
2
Beds
1
Bath
1,280
Sq Ft
$75/Sq Ft
Est. Value
About This Home
This home is located at 1521 Huey St, South Bend, IN 46628 and is currently estimated at $95,404, approximately $74 per square foot. 1521 Huey St is a home located in St. Joseph County with nearby schools including Darden Elementary School, Dickinson Fine Arts Academy, and Clay High School.
Ownership History
Date
Name
Owned For
Owner Type
Purchase Details
Closed on
Jan 27, 2023
Sold by
Hpp Loc3 Llc
Bought by
Syrs Investment Llc
Current Estimated Value
Home Financials for this Owner
Home Financials are based on the most recent Mortgage that was taken out on this home.
Original Mortgage
$47,000
Outstanding Balance
$46,145
Interest Rate
8%
Mortgage Type
New Conventional
Estimated Equity
$44,269
Purchase Details
Closed on
Nov 11, 2022
Sold by
Hpp Sb191 Holdings Llc
Bought by
Hpp Loc3 Llc
Purchase Details
Closed on
Jul 29, 2022
Sold by
Hpp Sb191 Holdings Llc
Bought by
Hpp Loc3 Llc
Purchase Details
Closed on
May 22, 2013
Sold by
Mfc South Bend Holdings Llc
Bought by
Mgc South Bend Holdings Ii Llc
Purchase Details
Closed on
Nov 14, 2012
Sold by
South Bend Property Iv Llc
Bought by
Mfc South Bend Holdings Llc
Purchase Details
Closed on
Jun 25, 2008
Sold by
Homeworks Funding Group Llc
Bought by
South Bend Property Iv Llc
Purchase Details
Closed on
Jun 7, 2007
Sold by
Shead Jamie R
Bought by
Abn Amro Mortgage Group Inc
Create a Home Valuation Report for This Property
The Home Valuation Report is an in-depth analysis detailing your home's value as well as a comparison with similar homes in the area
Home Values in the Area
Average Home Value in this Area
Purchase History
| Date | Buyer | Sale Price | Title Company |
|---|---|---|---|
| Syrs Investment Llc | $11,140 | -- | |
| Hpp Loc3 Llc | -- | Westcor Investor Services | |
| Hpp Loc3 Llc | -- | Westcor Investor Services | |
| Mgc South Bend Holdings Ii Llc | -- | Lawyers Title | |
| Mfc South Bend Holdings Llc | -- | Lawyers Title | |
| South Bend Property Iv Llc | -- | None Available | |
| Abn Amro Mortgage Group Inc | $42,794 | None Available |
Source: Public Records
Mortgage History
| Date | Status | Borrower | Loan Amount |
|---|---|---|---|
| Open | Syrs Investment Llc | $47,000 | |
| Previous Owner | Hpp Sb191holdings Llc | $6,605,900 | |
| Previous Owner | South Bend Property Iv Llc | $62,400 | |
| Closed | Syrs Investment Llc | $10,393 |
Source: Public Records
Tax History Compared to Growth
Tax History
| Year | Tax Paid | Tax Assessment Tax Assessment Total Assessment is a certain percentage of the fair market value that is determined by local assessors to be the total taxable value of land and additions on the property. | Land | Improvement |
|---|---|---|---|---|
| 2024 | $815 | $70,800 | $12,200 | $58,600 |
| 2023 | $815 | $32,400 | $12,200 | $20,200 |
| 2022 | $778 | $37,700 | $12,200 | $25,500 |
| 2021 | $638 | $24,800 | $1,600 | $23,200 |
| 2020 | $938 | $37,300 | $1,600 | $35,700 |
| 2019 | $789 | $37,300 | $1,600 | $35,700 |
| 2018 | $946 | $37,800 | $1,600 | $36,200 |
| 2017 | $957 | $36,700 | $1,600 | $35,100 |
| 2016 | $977 | $36,700 | $1,600 | $35,100 |
| 2014 | $954 | $36,500 | $1,600 | $34,900 |
Source: Public Records
Map
Nearby Homes
- 1525 N Olive St
- 1514 Obrien St
- 1321 Huey St
- 1618 Obrien St
- 1626 Fremont St
- 1945 N Olive St
- 722 N Olive St
- 1222 N Olive St
- 738 Huey St
- 1427 N Johnson St
- 1252 Fremont St
- 1614 N Johnson St
- 1226 N Elmer St
- 1302 N Meade St
- 1218 Huey St
- 1815 Elwood Ave
- 1714 N Johnson St
- 1333 College St
- 1742 Johnson St
- 1141 Fremont St