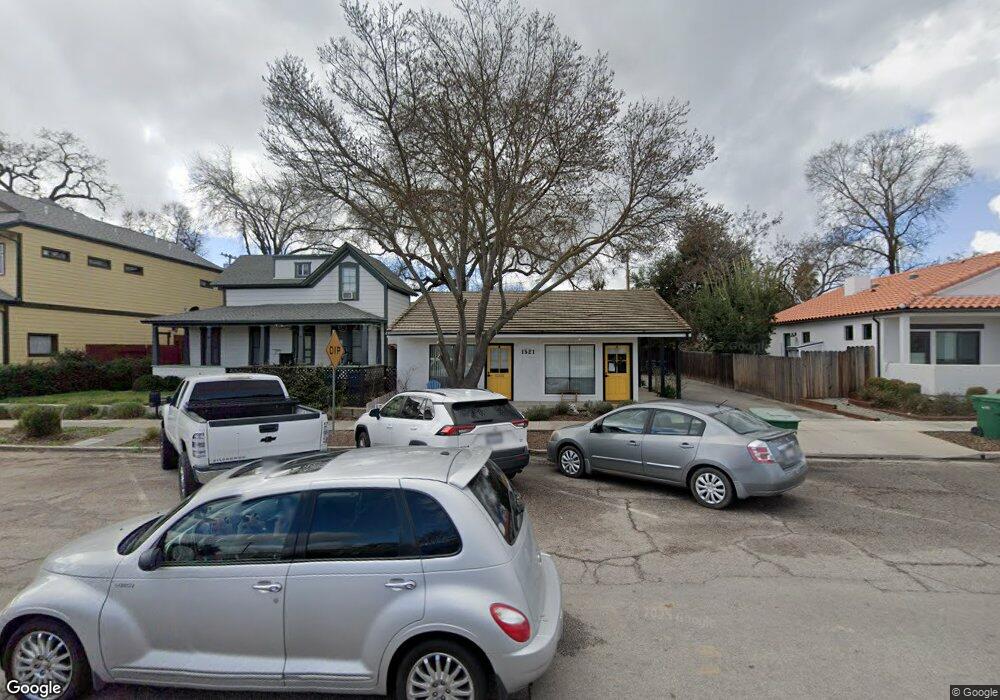
1521 Park St Unit C Paso Robles, CA 93446
Estimated Value: $713,597
--
Bed
--
Bath
315,950
Sq Ft
$2/Sq Ft
Est. Value
About This Home
This home is located at 1521 Park St Unit C, Paso Robles, CA 93446 and is currently estimated at $713,597, approximately $2 per square foot. 1521 Park St Unit C is a home located in San Luis Obispo County with nearby schools including Glen Speck Elementary School, George H. Flamson Middle School, and Paso Robles High School.
Ownership History
Date
Name
Owned For
Owner Type
Purchase Details
Closed on
Aug 31, 2013
Sold by
Griswold Craig
Bought by
Witte Michael Paul and Witte Sharon Brown
Current Estimated Value
Home Financials for this Owner
Home Financials are based on the most recent Mortgage that was taken out on this home.
Original Mortgage
$175,000
Outstanding Balance
$130,384
Interest Rate
4.36%
Mortgage Type
Seller Take Back
Estimated Equity
$583,213
Purchase Details
Closed on
Jul 1, 2010
Sold by
Dimauro Paul S and Dimauro Dolores
Bought by
Griswold Craig
Purchase Details
Closed on
Nov 9, 2005
Sold by
Griswold Craig
Bought by
Dimauro Paul S and Dimauro Dolores
Home Financials for this Owner
Home Financials are based on the most recent Mortgage that was taken out on this home.
Original Mortgage
$420,000
Interest Rate
6.31%
Mortgage Type
Commercial
Purchase Details
Closed on
Apr 24, 1998
Sold by
Cordano Carol A and Cordano Robert J
Bought by
Griswold George D and Griswold Audrey P
Create a Home Valuation Report for This Property
The Home Valuation Report is an in-depth analysis detailing your home's value as well as a comparison with similar homes in the area
Home Values in the Area
Average Home Value in this Area
Purchase History
| Date | Buyer | Sale Price | Title Company |
|---|---|---|---|
| Witte Michael Paul | $350,000 | First American Title Company | |
| Griswold Craig | -- | Fidelity National Title Co | |
| Dimauro Paul S | $500,000 | Fidelity Title Company | |
| Griswold George D | -- | -- |
Source: Public Records
Mortgage History
| Date | Status | Borrower | Loan Amount |
|---|---|---|---|
| Open | Witte Michael Paul | $175,000 | |
| Previous Owner | Dimauro Paul S | $420,000 |
Source: Public Records
Tax History Compared to Growth
Tax History
| Year | Tax Paid | Tax Assessment Tax Assessment Total Assessment is a certain percentage of the fair market value that is determined by local assessors to be the total taxable value of land and additions on the property. | Land | Improvement |
|---|---|---|---|---|
| 2025 | $4,676 | $429,040 | $214,520 | $214,520 |
| 2024 | $4,600 | $420,628 | $210,314 | $210,314 |
| 2023 | $4,600 | $412,382 | $206,191 | $206,191 |
| 2022 | $4,532 | $404,298 | $202,149 | $202,149 |
| 2021 | $4,677 | $396,372 | $198,186 | $198,186 |
| 2020 | $4,394 | $392,308 | $196,154 | $196,154 |
| 2019 | $4,331 | $384,616 | $192,308 | $192,308 |
| 2018 | $4,273 | $377,076 | $188,538 | $188,538 |
| 2017 | $4,018 | $369,684 | $184,842 | $184,842 |
| 2016 | $3,939 | $362,436 | $181,218 | $181,218 |
| 2015 | $3,924 | $356,992 | $178,496 | $178,496 |
| 2014 | $3,788 | $350,000 | $175,000 | $175,000 |
Source: Public Records
Map
Nearby Homes
- 1444 Vine St
- 13625 California 46
- 1803 Pine St
- 1232 Olive St
- 3730 Gruenhagen
- 1835 Oak St
- 1915 Pine St
- 0 Riverside Ave Unit PI25181393
- 144 17th St
- 144 12th St
- 2130 Vine St
- 818 Olive St
- 100 Piedmont Place
- 1714 Highland Park Dr
- 1551 Las Brisas Dr
- 649 Olive St
- 5 W 12th St
- 112 El Dorado Ct
- 420 Creston Rd
- 225 Pacific Ave
- 1521 Park St Unit D
- 1521 Park St
- 1527 Park St
- 1535 Park St
- 1503 Park St
- 1503 Park St Unit 201 1
- 1503 Park St Unit 101 3
- 1503 Park St Unit 101 1
- 1503 Park St Unit 202-3
- 1503 Park St Unit 5
- 1503 Park St Unit 4
- 1503 Park St Unit 3
- 1503 Park St Unit 1
- 1503 Park St Unit 2
- 1502 15th St
- 1502 15th St Unit Upper Office
- 1502 15th St Unit D
- 1502 15th St Unit B
- 1545 Park St
- 1502 Spring St